


In the intricate landscape of software architecture, clarity is often the difference between a stable system and a fragile one. When components interact, the movement of data dictates performance, security, and reliability. To communicate these interactions effectively, developers rely on standardized visual languages. Among these, the Unified Modeling Language (UML) sequence diagram stands out as the primary tool for mapping dynamic behavior. This guide provides a deep dive into constructing these diagrams, focusing on the visualization of data flow through a practical case study.
Understanding how objects communicate over time is essential for debugging, documentation, and design refinement. By following a structured approach, teams can ensure that every request, response, and state change is accounted for. This article breaks down the process into actionable steps, eliminating ambiguity and ensuring that the resulting diagram serves as a reliable blueprint for development.
🧩 Understanding the Core Components
Before constructing a complex diagram, one must grasp the fundamental building blocks. A sequence diagram is essentially a timeline of interactions. It displays objects or participants and the messages passed between them. The following elements form the skeleton of any effective diagram:
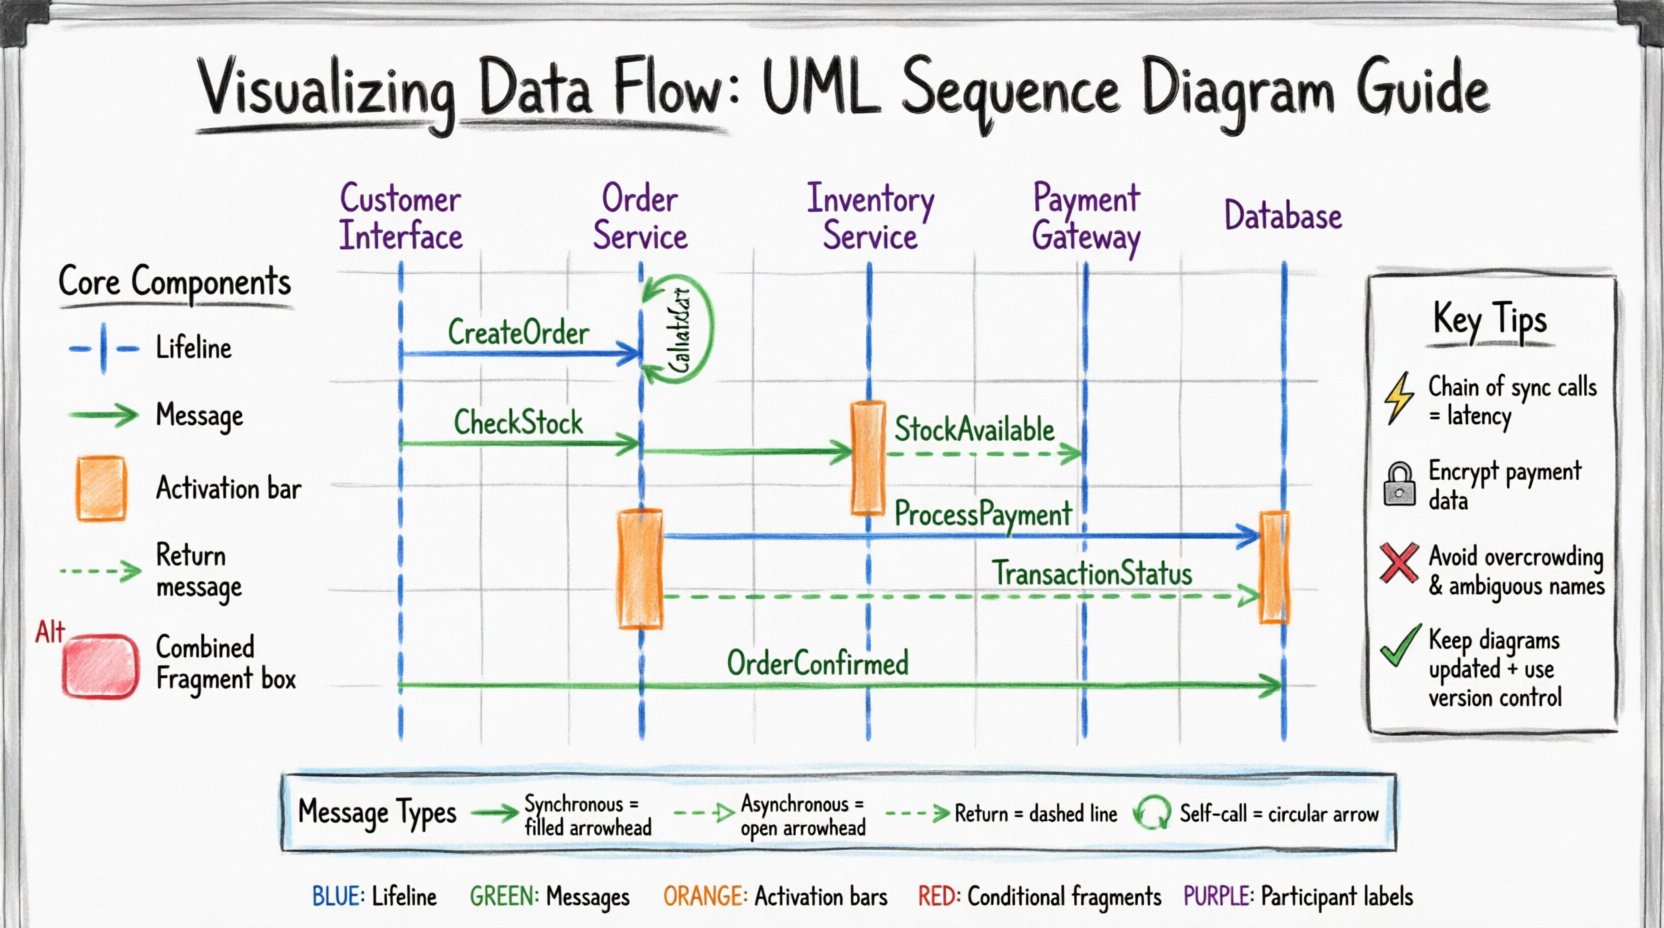
- Lifelines: Represent the existence of a participant over time. These are vertical dashed lines extending downward.
- Messages: Horizontal arrows indicating communication. They define the flow of control and data.
- Activation Bars: Rectangles on the lifeline showing when an object is actively processing a message.
- Return Messages: Often dashed lines indicating a response or data return to the caller.
- Combined Fragments: Boxes that encapsulate specific logic like loops, alternatives, or optional sections.
Each component serves a specific purpose in documenting the lifecycle of a transaction. Without accurate representation of these elements, the diagram fails to convey the necessary logic to stakeholders.
🏗️ The Scenario Context
To demonstrate the practical application of these concepts, consider a standard e-commerce order processing scenario. This case study involves a user initiating a purchase, validating payment, and updating inventory. The system is divided into logical layers to ensure separation of concerns.
The participants involved in this flow include:
- Customer Interface: The frontend application where the user interacts.
- Order Service: The backend logic handling business rules.
- Inventory Service: Manages stock levels and availability.
- Payment Gateway: An external system responsible for financial transactions.
- Database: Persists the order and transaction records.
The goal is to visualize the sequence of calls required to complete a single order from initiation to confirmation. This scenario highlights the complexity of distributed systems where data must traverse multiple boundaries.
📝 Step 1 – Identifying Participants
The first step in any diagramming exercise is defining the scope. You must determine which actors and systems are relevant to the specific interaction being modeled. In this case, the scope is limited to the order creation process.
- Define the Actor: Who initiates the action? Here, it is the Customer Interface.
- Define the System Boundary: What internal services are touched? The Order Service and Inventory Service.
- Define External Dependencies: What third-party systems are involved? The Payment Gateway.
By limiting the scope, the diagram remains readable. Including unrelated processes, such as user login or product search, would clutter the view and obscure the primary data flow.
📝 Step 2 – Establishing Lifelines
Once participants are identified, they are arranged horizontally at the top of the diagram. Each participant gets a vertical dashed line extending downwards. This line represents the lifespan of the object during the interaction.
| Participant | Role | Responsibility |
|---|---|---|
| Customer Interface | Client | Collects input and displays results |
| Order Service | Controller | Orchestrates the order process |
| Inventory Service | Provider | Checks and reserves stock |
| Payment Gateway | External | Validates funds and processes payment |
| Database | Storage | Persists order data |
Arranging these lifelines logically is crucial. Typically, the initiating actor is placed on the left, followed by the internal controllers, and finally the external dependencies on the right. This left-to-right progression mirrors the natural flow of a request.
📝 Step 3 – Mapping the Interaction Flow
With the structure in place, the next phase is drawing the messages. These arrows represent the actual data transfer. The direction of the arrow indicates the sender and receiver.
3.1 The Initial Request
The process begins when the Customer Interface sends a CreateOrder message to the Order Service. This is a synchronous call, meaning the caller waits for a response. The activation bar on the Order Service lifeline begins here, indicating it is now busy processing.
3.2 Inventory Validation
Before finalizing the order, the system must ensure items are available. The Order Service sends a CheckStock message to the Inventory Service. The Inventory Service queries the Database, updates its local state, and returns a StockAvailable boolean value. The Order Service then activates the Database to save the reservation.
3.3 Payment Processing
Once stock is confirmed, the Order Service forwards the transaction details to the Payment Gateway. This is often an asynchronous call in high-volume systems, but for this diagram, we treat it as a blocking operation to ensure atomicity. The Gateway returns a TransactionStatus message.
3.4 Finalizing the Order
If all checks pass, the Order Service writes the final order record to the Database and sends a OrderConfirmed message back to the Customer Interface. The activation bars on all lifelines return to zero, signaling the completion of the transaction.
📝 Step 4 – Handling Logic and Conditions
Real-world systems rarely follow a single linear path. Exceptions, failures, and conditional logic must be represented using Combined Fragments. These are rectangular frames with a specific operator in the top-left corner.
- Alt (Alternative): Used for if-else logic. For example, if payment fails, the flow branches to an error handler.
- Opt (Optional): Indicates a message that may or may not occur. This is useful for optional features like gift wrapping.
- Loop: Represents repetitive actions, such as iterating through a list of items in a cart.
In our case study, an Alt fragment is critical around the Payment Gateway interaction. If the TransactionStatus returns Failed, the Order Service must trigger a rollback of the inventory reservation and notify the user. Without this conditional block, the diagram implies success is guaranteed, which is a dangerous assumption in system design.
🔍 Analyzing the Data Flow
Once the diagram is constructed, it serves as a tool for analysis. Stakeholders can review the visualization to identify bottlenecks, security risks, or inefficiencies.
Performance Implications
Every arrow on the diagram represents network latency or processing time. A long chain of synchronous calls increases the total response time. If the Order Service waits for the Payment Gateway, which waits for the Database, the user interface may hang. Recognizing this allows architects to introduce asynchronous patterns or caching strategies.
Security Considerations
The diagram reveals data sensitivity. Messages sent to the Payment Gateway should be encrypted. Messages to the Database should be validated against injection attacks. Visualizing the flow helps security teams identify where authentication tokens must be passed and where data privacy rules apply.
🚧 Common Implementation Errors
Even experienced practitioners make mistakes when documenting system behavior. Avoiding these pitfalls ensures the diagram remains a useful asset rather than technical debt.
- Overcrowding: Including too many messages makes the diagram unreadable. Focus on the critical path.
- Ambiguous Messages: Messages should be named clearly, such as PlaceOrder rather than Action1.
- Missing Returns: Failing to show return messages obscures the flow of data back to the user.
- Inconsistent Time Flow: Messages should generally flow top to bottom. Crossing arrows randomly confuses the timeline.
A clean diagram respects the principles of minimalism. Every line should add value to the understanding of the system.
🛠️ Best Practices for Maintenance
Software evolves, and diagrams must evolve with it. An outdated diagram is worse than no diagram at all, as it creates false expectations. To maintain accuracy:
- Update with Changes: Whenever code logic changes, the diagram should be reviewed and updated.
- Use Naming Conventions: Adopt a standard for message names across the organization.
- Version Control: Store diagram files in the same repository as the source code to track history.
- Review in Standups: Use the diagram during team meetings to align on implementation details.
Documentation is not a one-time task. It is a living artifact that supports the engineering team. By treating the sequence diagram as a primary source of truth, teams reduce miscommunication and integration errors.
📊 Message Types Comparison
Different types of messages behave differently in a system. Understanding these distinctions helps in designing robust interfaces.
| Message Type | Arrow Style | Behavior | Use Case |
|---|---|---|---|
| Synchronous | Filled Arrowhead | Caller waits for response | Immediate data retrieval |
| Asynchronous | Open Arrowhead | Caller does not wait | Background tasks |
| Return | Dashed Line | Response to caller | Data return |
| Self-Call | Circular Arrow | Object calls itself | Internal processing |
Selecting the correct arrow type communicates intent. A synchronous call implies a dependency, whereas an asynchronous call implies independence.
🔚 Final Observations
Visualizing data flow through UML sequence diagrams is a foundational skill for any technical professional. It transforms abstract code into a tangible narrative of interaction. By following the steps outlined in this case study, teams can create diagrams that are accurate, maintainable, and insightful.
The process requires attention to detail regarding lifelines, message types, and logical conditions. However, the payoff is a shared understanding of the system that aligns development, testing, and operations. When the data flow is clear, the system becomes predictable. Predictability is the bedrock of reliable software.
As you move forward with your own projects, apply these principles rigorously. Start small, validate frequently, and ensure that your documentation reflects the reality of the code. In doing so, you contribute to a culture of clarity and precision that benefits the entire engineering lifecycle.