


Introduction
In the dynamic landscape of modern business, efficiency is not just a goal—it is a necessity. Organizations constantly strive to optimize operations, reduce waste, and enhance customer satisfaction. At the heart of these efforts lies Business Process Improvement (BPI), a disciplined approach to identifying, analyzing, and improving existing business processes.
Central to BPI is the As-Is/To-Be Analysis, a foundational technique that allows organizations to visualize the gap between their current operational state (“As-Is”) and their desired future state (“To-Be”). While flowcharts and swimlane diagrams are common tools for this analysis, Sequence Diagrams offer a unique and powerful perspective. They excel at illustrating the chronological order of interactions between different actors (people, systems, or departments), making them ideal for uncovering communication bottlenecks, latency issues, and integration gaps.
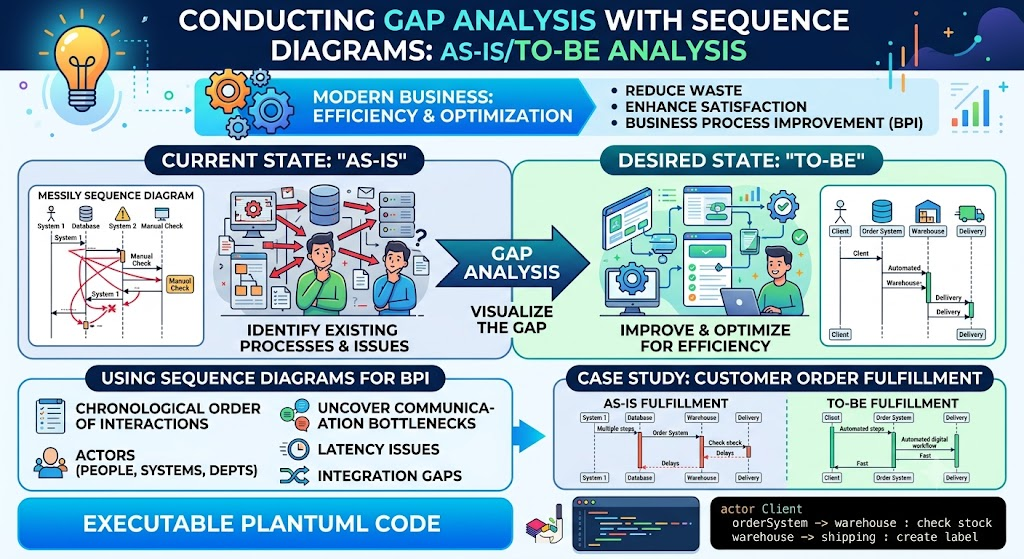
This guide provides a comprehensive framework for conducting Gap Analysis using Sequence Diagrams. We will explore key concepts, demonstrate the methodology with a detailed case study on Customer Order Fulfillment, and provide executable PlantUML code to help you visualize your own processes. By mastering this technique, you can create a clear roadmap for transformation, ensuring that your “To-Be” processes are not only efficient but also technically feasible and aligned with organizational goals.
Understanding As-Is/To-Be Analysis
What is As-Is/To-Be Analysis?
As-Is/To-Be analysis is a structured method used to document the current state of a process and design an improved future state. It serves as the bridge between problem identification and solution implementation.
1. As-Is Analysis: The Current Reality
The “As-Is” phase is about honest documentation. It involves mapping out how work actually gets done, not necessarily how it should be done according to policy manuals.
-
Process Mapping: Creating visual representations of the current workflow.
-
Data Collection: Gathering metrics on cycle times, error rates, and resource usage.
-
Stakeholder Interviews: Engaging with employees to understand pain points and workarounds.
-
Identifying Inefficiencies: Pinpointing bottlenecks, redundant steps, and manual interventions.
2. To-Be Analysis: The Future Vision
The “To-Be” phase is about innovation and design. It focuses on creating a streamlined process that addresses the issues found in the As-Is analysis.
-
Redesigning the Process: Eliminating non-value-added steps and automating manual tasks.
-
Defining Roles: Clarifying responsibilities to avoid ambiguity.
-
Technology Integration: Leveraging new tools or systems to enhance efficiency.
-
Setting KPIs: Establishing metrics to measure the success of the new process.
How It Relates to Business Process Improvement (BPI)
As-Is/To-Be analysis is the engine of BPI. It drives the following critical activities:
-
Identification of Opportunities: The As-Is analysis reveals where time and money are being wasted.
-
Designing Efficient Processes: The To-Be analysis creates a blueprint for a leaner, faster operation.
-
Change Management: By clearly showing the difference between the old and new ways of working, organizations can better prepare employees for transition.
-
Continuous Improvement: BPI is iterative. Once the To-Be process is implemented, it becomes the new As-Is, and the cycle begins again.
Why Use Sequence Diagrams for Gap Analysis?
While flowcharts show what happens, sequence diagrams show who interacts with whom and when. This temporal perspective is crucial for identifying:
-
Latency: Delays caused by waiting for responses from other systems or departments.
-
Integration Gaps: Missing connections between software systems that require manual data re-entry.
-
Communication Overhead: Excessive back-and-forth messages that slow down the process.
Key Elements of a Sequence Diagram
-
Lifelines: Represent the participants (actors, systems, or departments).
-
Messages: Arrows indicating communication or data transfer between lifelines.
-
Activation Bars: Rectangles on lifelines showing when an object is performing an action.
-
Notes/Constraints: Additional information explaining specific conditions or issues.
Case Study: Streamlining Customer Order Fulfillment
Problem Statement
XYZ Retail Corp is experiencing significant delays in its order fulfillment process. Customers complain about long wait times, incorrect shipments, and lack of status updates. The current process relies heavily on manual emails and spreadsheet updates, leading to errors and inefficiencies. XYZ Retail aims to automate and streamline this process to improve customer satisfaction and operational speed.
As-Is Process Description
The current order fulfillment process involves multiple manual handoffs:
-
Customer places an order via the website.
-
Website sends an email notification to the Sales Team.
-
Sales Team manually enters order details into an Excel spreadsheet.
-
Sales Team emails the Warehouse Team with order details.
-
Warehouse Team checks inventory manually.
-
If items are available, Warehouse picks and packs the order.
-
Warehouse emails Shipping Provider with pickup details.
-
Shipping Provider picks up the package and updates status via phone call to Warehouse.
-
Warehouse manually updates the Excel spreadsheet and emails the Customer with tracking info.
Issues with the As-Is Process
-
Manual Data Entry: High risk of typos and errors when transferring data from email to Excel.
-
Communication Delays: Reliance on email and phone calls causes significant lag time.
-
Lack of Real-Time Visibility: Neither customers nor internal teams have real-time access to order status.
-
Inventory Inaccuracy: Manual inventory checks lead to overselling and stockouts.
To-Be Process Goals
The goal is to create an automated, integrated order fulfillment system:
-
Reduce order processing time by 70%.
-
Eliminate manual data entry through system integration.
-
Provide real-time inventory checks and order status updates.
-
Automate communication with shipping providers.
-
Enable self-service tracking for customers.
Summarizing Findings of the As-Is Scenario
As-Is Process Table
| Step | Description of Step | Responsible Party | Input | Output | Issues/Challenges |
|---|---|---|---|---|---|
| 1 | Customer places order | Customer | Order details | Order confirmation email | No immediate system validation |
| 2 | Sales receives notification | Sales Team | Email notification | Order details in inbox | Manual monitoring required |
| 3 | Manual data entry | Sales Team | Email content | Excel spreadsheet record | Error-prone, time-consuming |
| 4 | Notify Warehouse | Sales Team | Excel record | Email to Warehouse | Delay in communication |
| 5 | Check Inventory | Warehouse Team | Email request | Manual inventory check | Inaccurate stock levels |
| 6 | Pick and Pack | Warehouse Team | Physical items | Packed order | Manual process |
| 7 | Notify Shipping Provider | Warehouse Team | Packed order details | Email to Shipping Provider | Manual coordination |
| 8 | Pickup and Status Update | Shipping Provider | Package | Phone call to Warehouse | Unstructured status update |
| 9 | Update Customer | Warehouse/Sales | Tracking info | Email to Customer | Delayed notification |
Representing As-Is Scenario with a Sequence Diagram
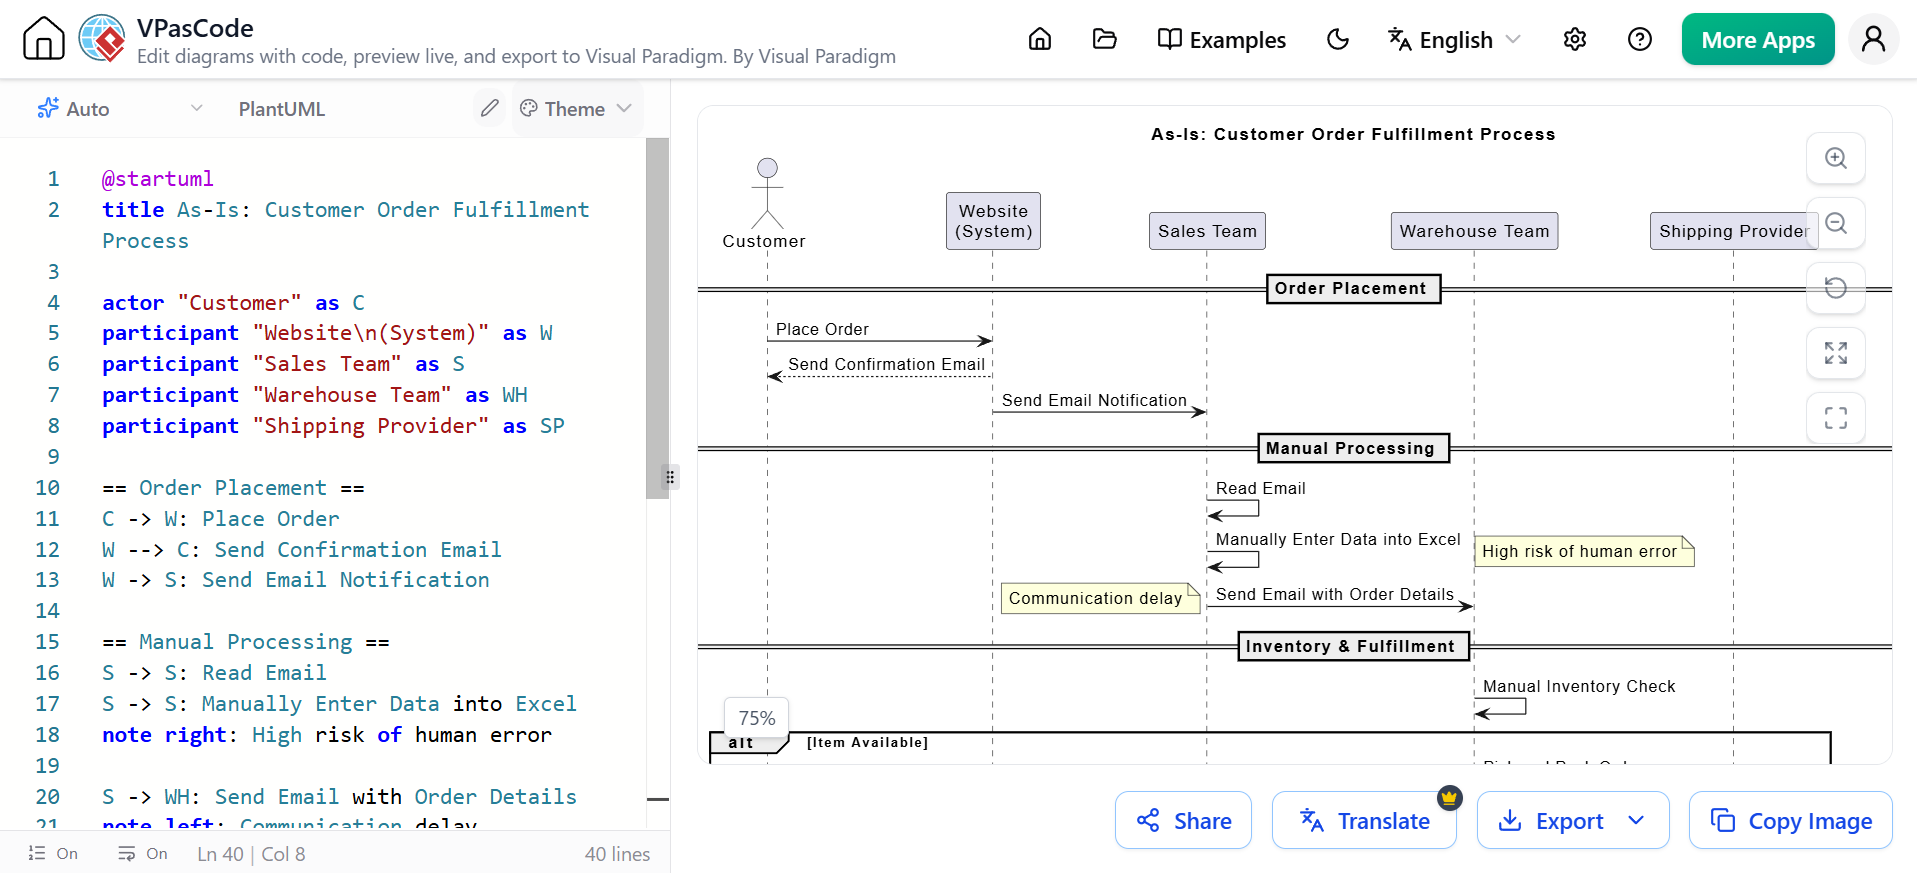
The following PlantUML code generates a sequence diagram illustrating the inefficient, manual-heavy As-Is process. Note the numerous manual steps and asynchronous communications (emails/phone calls) that create delays.
@startuml
title As-Is: Customer Order Fulfillment Process

actor "Customer" as C
participant "Website\n(System)" as W
participant "Sales Team" as S
participant "Warehouse Team" as WH
participant "Shipping Provider" as SP

== Order Placement ==
C -> W: Place Order
W --> C: Send Confirmation Email
W -> S: Send Email Notification

== Manual Processing ==
S -> S: Read Email
S -> S: Manually Enter Data into Excel
note right: High risk of human error

S -> WH: Send Email with Order Details
note left: Communication delay

== Inventory & Fulfillment ==
WH -> WH: Manual Inventory Check
alt Item Available
    WH -> WH: Pick and Pack Order
    WH -> SP: Send Email for Pickup
else Item Out of Stock
    WH -> S: Email Stockout Notice
    S -> C: Email Cancellation
end

== Shipping & Notification ==
SP -> SP: Pickup Package
SP -> WH: Phone Call with Tracking Info
note right: Unstructured communication
WH -> WH: Manually Update Excel
WH -> C: Email Tracking Information

@enduml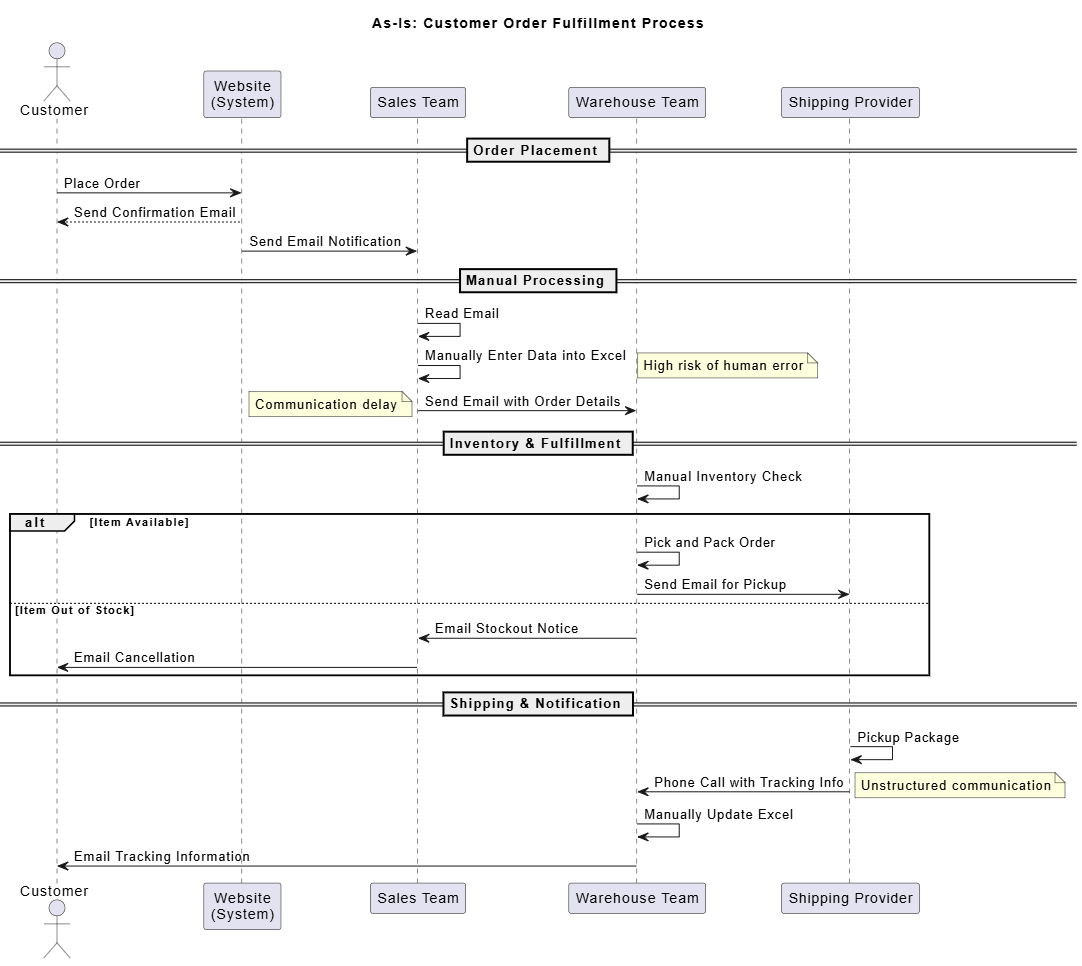
(Note: You can render this code using any PlantUML editor or Visual Paradigm VPas)
Summarizing Findings of the To-Be Scenario
To-Be Process Table
| Step | Description of Step | Responsible Party | Input | Output | Improvements/Changes |
|---|---|---|---|---|---|
| 1 | Customer places order | Customer | Order details | Real-time order confirmation | Immediate validation |
| 2 | Automated Order Processing | System | Order data | Auto-created order record | Eliminate manual entry |
| 3 | Real-time Inventory Check | System | Order items | Availability confirmation | Accurate stock levels |
| 4 | Auto-Notify Warehouse | System | Confirmed order | Digital pick list | Instant communication |
| 5 | Pick and Pack | Warehouse Team | Digital pick list | Packed order | Guided by system |
| 6 | Auto-Generate Shipping Label | System | Order details | Shipping label & API call | Integrated with carrier |
| 7 | Automated Status Update | System | Carrier API response | Real-time tracking link | No manual updates needed |
| 8 | Customer Notification | System | Tracking link | SMS/Email to Customer | Proactive communication |
Representing To-Be Scenario with a Sequence Diagram
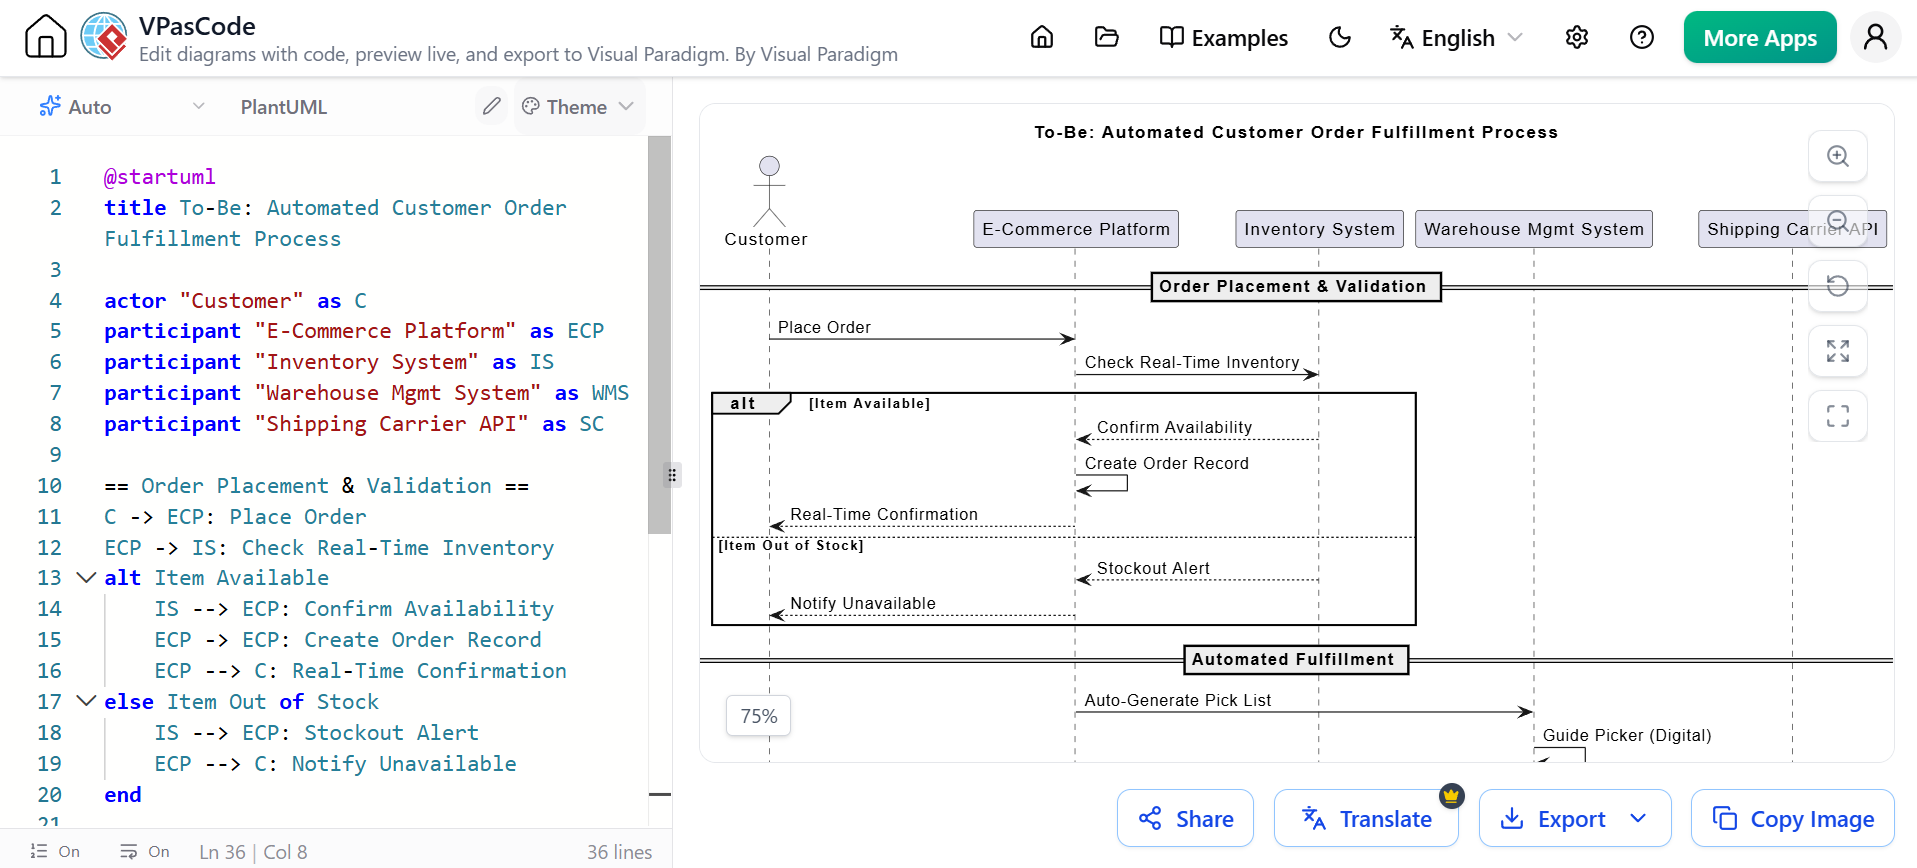
The following PlantUML code illustrates the streamlined, automated To-Be process. Notice the direct integrations between systems and the reduction in manual intervention.
@startuml
title To-Be: Automated Customer Order Fulfillment Process

actor "Customer" as C
participant "E-Commerce Platform" as ECP
participant "Inventory System" as IS
participant "Warehouse Mgmt System" as WMS
participant "Shipping Carrier API" as SC

== Order Placement & Validation ==
C -> ECP: Place Order
ECP -> IS: Check Real-Time Inventory
alt Item Available
    IS --> ECP: Confirm Availability
    ECP -> ECP: Create Order Record
    ECP --> C: Real-Time Confirmation
else Item Out of Stock
    IS --> ECP: Stockout Alert
    ECP --> C: Notify Unavailable
end

== Automated Fulfillment ==
ECP -> WMS: Auto-Generate Pick List
WMS -> WMS: Guide Picker (Digital)
WMS -> WMS: Pack Order

== Integrated Shipping ==
WMS -> SC: Request Shipping Label (API)
SC --> WMS: Return Label & Tracking ID
WMS -> ECP: Update Order Status

== Customer Notification ==
ECP -> C: Send SMS/Email with Tracking Link
note right: Proactive, real-time update

@enduml
Gap Analysis: Bridging the Divide Between Manual and Automated Fulfillment
The transition from the As-Is to the To-Be state is not merely a technological upgrade; it is a fundamental restructuring of how value is delivered to the customer. By juxtaposing the two sequence diagrams above, we can perform a precise gap analysis that highlights specific operational deficiencies and maps them directly to targeted improvements.
Identifying the Gaps
A detailed comparison of the As-Is and To-Be sequence diagrams reveals four critical gaps in the current XYZ Retail Corp fulfillment process:
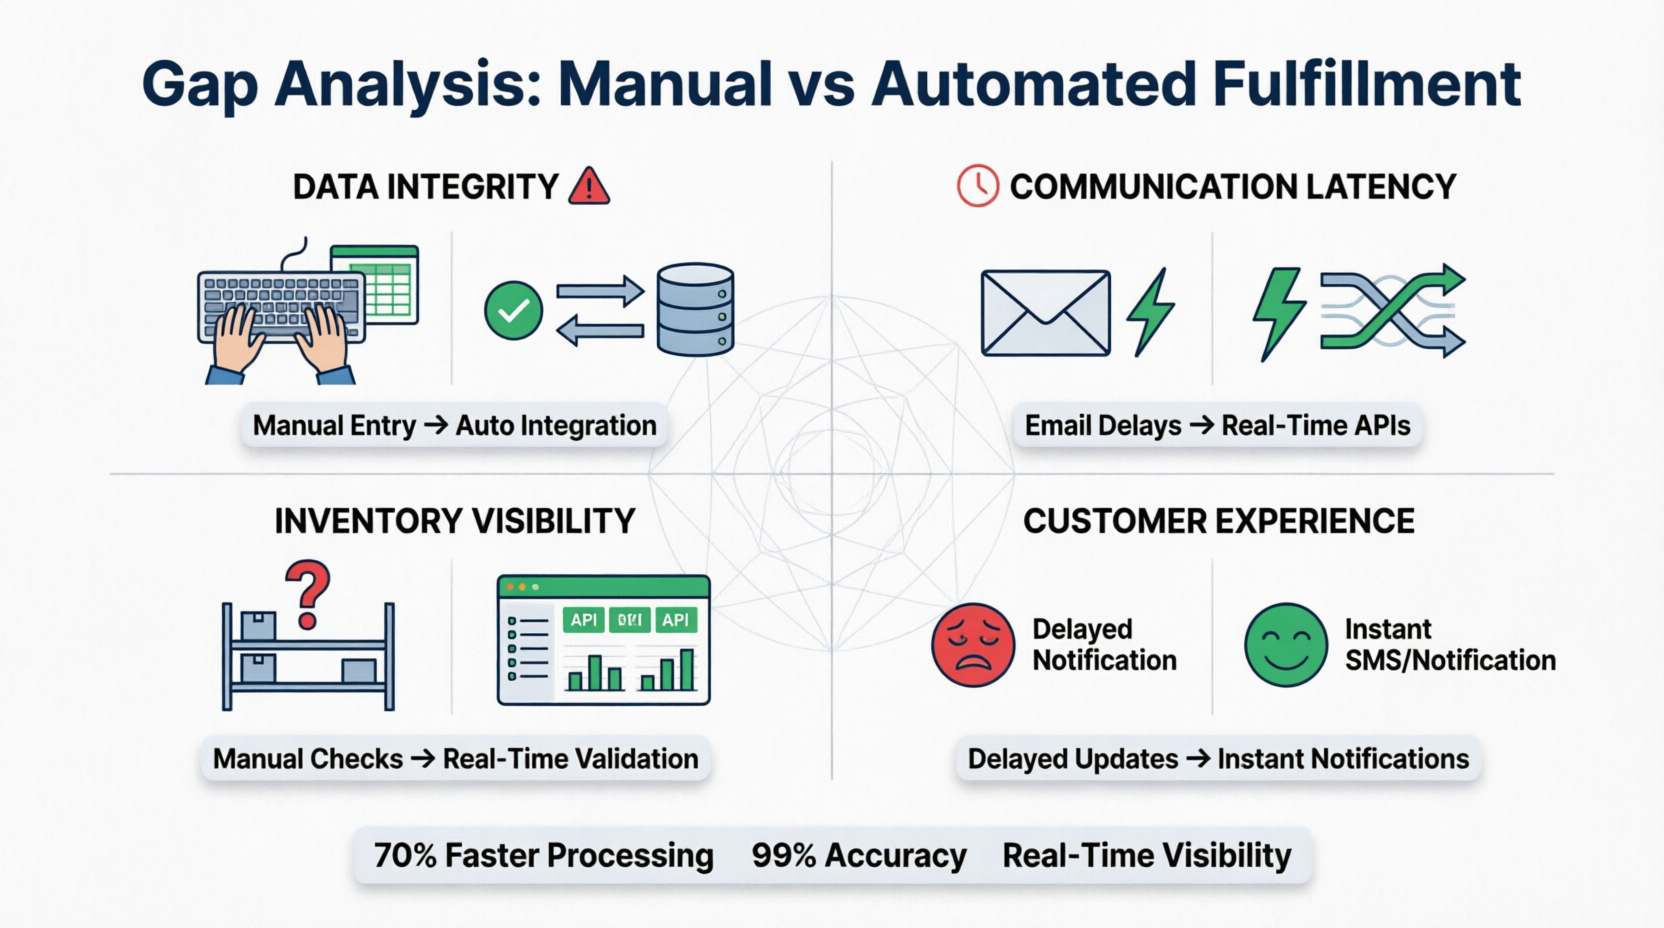
| Gap Category | As-Is State (Current) | To-Be State (Future) | Impact of Gap |
|---|---|---|---|
| Data Integrity | Sales team manually re-keys order data from email into Excel. | E-Commerce Platform automatically creates order records via API integration. | High risk of transcription errors leading to wrong shipments and returns. |
| Communication Latency | Reliance on asynchronous emails and phone calls between Sales, Warehouse, and Shipping. | Real-time system-to-system messaging (APIs, digital pick lists). | Order processing delayed by hours or days due to waiting for human intervention. |
| Inventory Visibility | Warehouse performs manual physical checks only after order is received. | Real-time inventory validation occurs at the point of sale. | Overselling, stockouts, and subsequent order cancellations damage customer trust. |
| Customer Experience | Customer receives tracking info only after warehouse manually updates Excel post-pickup. | Automated SMS/Email triggered instantly upon carrier label generation. | Customers experience anxiety and increased support ticket volume due to lack of visibility. |
Key Improvements Realized
Addressing these gaps through the To-Be process design delivers measurable business value:
-
Elimination of Non-Value-Added Work: By removing manual data entry and email coordination, staff are freed from administrative tasks and can focus on exception handling and quality control. This directly supports the goal of reducing processing time by 70%.
-
Error Prevention at Source: Real-time inventory checks prevent orders from being placed for unavailable items, eliminating the costly reverse logistics cycle of cancellations and refunds. Data accuracy improves from an estimated 85% (manual entry) to near 100% (system integration).
-
Predictable Cycle Times: Automated workflows remove human variability from the fulfillment equation. Orders placed before a cutoff time can be guaranteed same-day processing, enabling reliable SLAs for customers.
-
Scalability Without Linear Cost Growth: The automated To-Be process can handle 3x or 5x order volume without requiring proportional increases in sales or warehouse administrative staff. Growth becomes a function of system capacity rather than headcount.
Creating an Implementation Plan
Transitioning from the As-Is to the To-Be state requires a structured approach. Below is a three-month implementation plan for XYZ Retail Corp’s order fulfillment optimization.
Implementation Plan for Automated Order Fulfillment
Objective: Replace manual order processing with an integrated, automated system within three months to reduce processing time by 70% and eliminate data entry errors.
Month 1: Analysis and Planning (Weeks 1-4)
-
Week 1-2: Project Kickoff and Team Formation
-
Assemble cross-functional team: IT, Sales, Warehouse, and Customer Service.
-
Define project scope, objectives, and success metrics (KPIs).
-
-
Week 3: As-Is Process Documentation
-
Map the current As-Is process using sequence diagrams (as shown above).
-
Identify all manual touchpoints and integration gaps.
-
-
Week 4: Stakeholder Engagement and Requirements Gathering
-
Interview warehouse staff and sales team to understand pain points.
-
Define technical requirements for system integration (APIs, data formats).
-
Month 2: System Design and Development (Weeks 5-8)
-
Week 5: To-Be Process Design
-
Design the new automated workflow using To-Be sequence diagrams.
-
Select technology partners (e.g., Shipping Carrier API provider).
-
-
Week 6-7: System Integration and Development
-
Develop APIs to connect E-Commerce Platform, Inventory System, and Warehouse Management System.
-
Implement real-time inventory checking logic.
-
-
Week 8: Testing and Quality Assurance
-
Conduct unit testing of individual components.
-
Perform end-to-end integration testing with sample orders.
-
Month 3: Implementation and Monitoring (Weeks 9-12)
-
Week 9: Pilot Testing
-
Run the new process with a small subset of orders (e.g., 10% of volume).
-
Monitor for errors and gather feedback from warehouse staff.
-
-
Week 10-11: Full Rollout
-
Switch over all order processing to the new automated system.
-
Provide training for staff on handling exceptions (e.g., damaged goods).
-
-
Week 12: Performance Monitoring and Optimization
-
Track KPIs: Order processing time, error rate, customer satisfaction scores.
-
Address any post-launch issues and fine-tune system parameters.
-
Post-Implementation (Ongoing)
-
Continuous Improvement
-
Regularly review system performance logs.
-
Explore further automation opportunities (e.g., AI-driven demand forecasting).
-
Conclusion
As-Is/To-Be analysis using sequence diagrams is a powerful methodology for driving business process improvement. By visualizing the chronological interactions between actors and systems, organizations can pinpoint inefficiencies that might be missed in traditional flowcharts. The case study of XYZ Retail Corp demonstrates how transitioning from a manual, email-dependent process to an automated, integrated system can dramatically improve efficiency, accuracy, and customer satisfaction.
Key takeaways include:
-
Visual Clarity: Sequence diagrams provide a clear view of communication flows and delays.
-
Gap Identification: Comparing As-Is and To-Be diagrams highlights exactly where automation and integration are needed.
-
Structured Implementation: A phased approach ensures a smooth transition and minimizes disruption.
For organizations looking to implement this methodology, Visual Paradigm is a highly recommended tool. It offers robust support for creating both As-Is and To-Be sequence diagrams, allowing teams to easily visualize, compare, and communicate process changes. With its intuitive interface and comprehensive feature set, Visual Paradigm empowers businesses to bridge the gap between their current reality and their future potential, driving continuous improvement and operational excellence.
Related posts:
 Avoiding Pitfalls with AI Activity Diagrams: Streamlining Content Approval & Publishing Cycle
 Revolutionizing Diagramming with VPasCode’s Unified Text-to-Diagram Platform
 Mastering UML Sequence Diagrams: A Comprehensive Guide to Modeling Dynamic Interactions
 10x Agile Documentation Speed: Instant AI Diagram Generation for Teams