


In distributed system architecture, communication is the backbone of functionality. When moving from a monolithic structure to microservices, the complexity of interactions increases exponentially. Visualizing these interactions becomes not just a documentation exercise, but a critical engineering activity. UML Sequence Diagrams provide a standardized way to represent these interactions over time. This guide explores how to apply these diagrams specifically to microservice environments, ensuring clarity, maintainability, and robust system design.
Developers often face the challenge of tracing a single user request as it hops across multiple services, databases, and external APIs. Without a clear visual representation, debugging latency or failure points becomes a guessing game. A well-constructed sequence diagram maps the flow of messages, the state of participants, and the timing of events. It serves as a contract between teams and a blueprint for implementation.
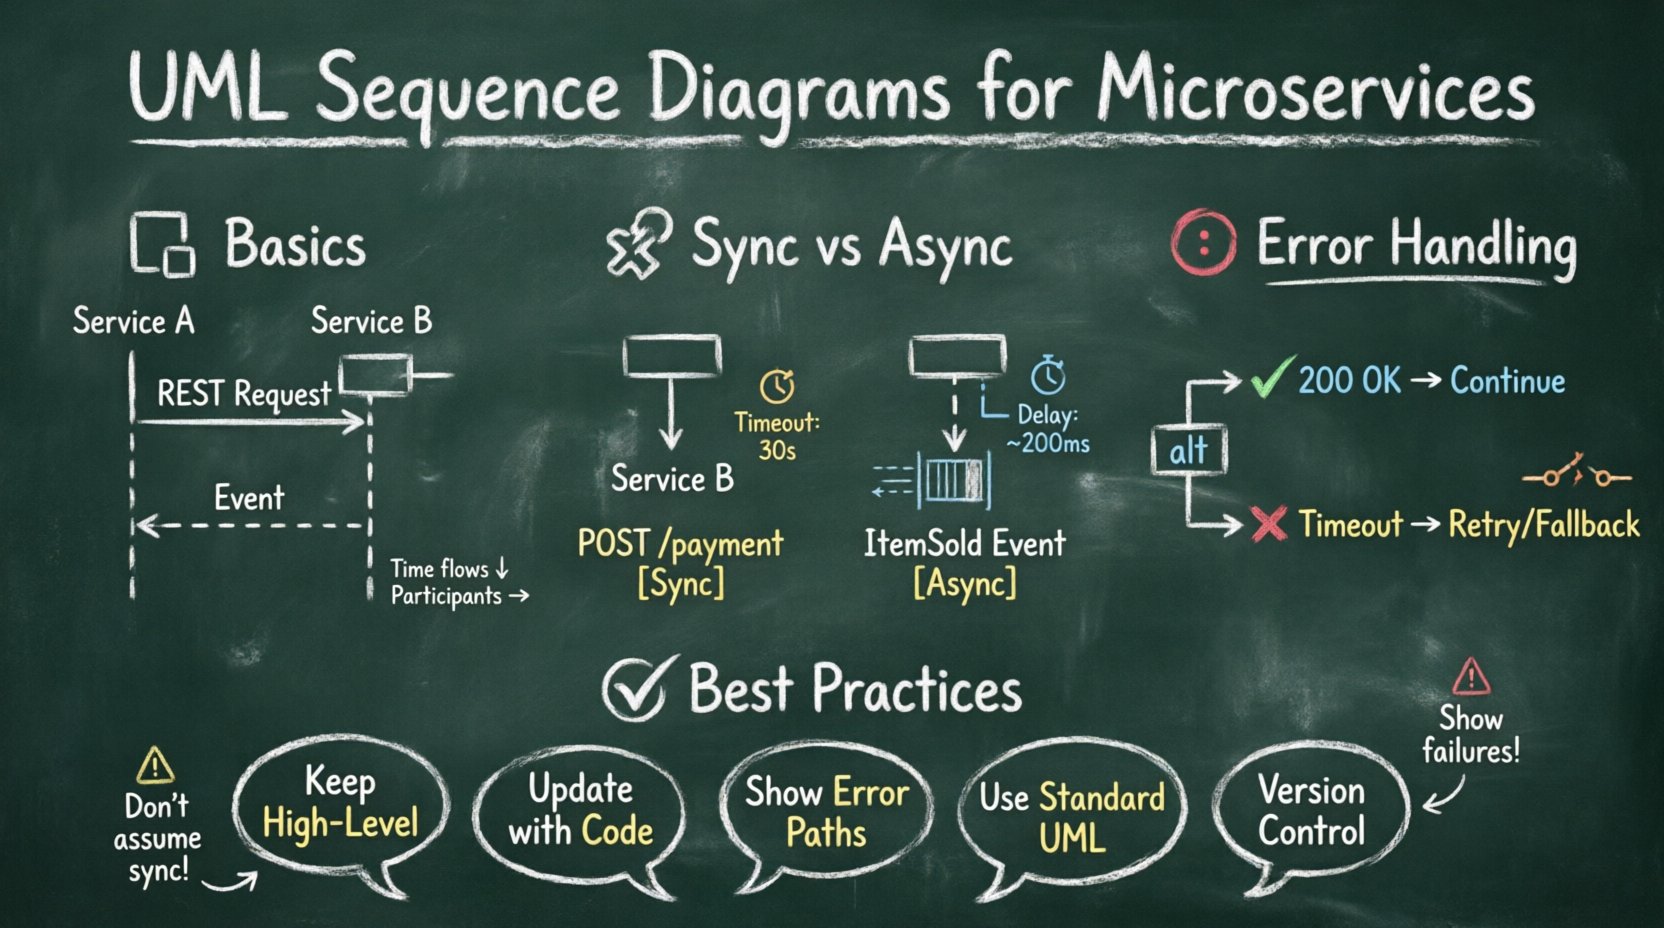
📐 Understanding the Sequence Diagram Basics
Before diving into the nuances of distributed systems, it is essential to establish a solid foundation. A sequence diagram is a type of interaction diagram. It shows how objects operate with one another and in what order. The horizontal axis represents different participants, while the vertical axis represents the progression of time.
- Lifelines: These are vertical dashed lines representing a participant in the interaction. In microservices, this could be a specific service instance, a database, or a gateway.
- Messages: Arrows drawn between lifelines indicate communication. They can be solid (synchronous) or dashed (asynchronous).
- Activation Bars: Rectangles placed on lifelines indicate when a participant is actively performing an action or waiting for a response.
- Focus of Control: The activation bar shows the period during which the object is performing an operation.
Standard diagrams work well for simple applications. However, microservices introduce network latency, eventual consistency, and partial failures. These factors require specific notations and considerations that go beyond basic object-oriented modeling.
🧩 Why Microservices Need Specific Diagramming Approaches
Monolithic applications often rely on in-memory calls. Microservices rely on network calls. This fundamental shift changes the nature of the sequence diagram. In a monolith, a method call is instantaneous. In a microservice architecture, a request involves serialization, network transmission, routing, and deserialization.
Developers must account for these realities in their diagrams. Ignoring network behavior can lead to code that assumes immediate responses, causing timeouts and cascading failures in production. The following points highlight why a specific approach is necessary:
- Network Reliability: Connections can drop. The diagram must show error paths and retries.
- Asynchronous Nature: Not all services respond immediately. Some events trigger background processing.
- Statelessness: Services often do not hold session state. The diagram must reflect how state is passed or retrieved.
- Observability: Tracing IDs must be carried across services. This should be visible in the message flow.
🔑 Core Components in a Microservice Sequence Diagram
To accurately model microservices, certain components require special attention. Standard UML notations need to be interpreted with the context of distributed computing in mind. The table below outlines the standard component and its microservice-specific adaptation.
| Standard Component | Microservice Adaptation | Purpose |
|---|---|---|
| Lifeline | Service Instance / API Gateway | Identifies the network endpoint or container. |
| Synchronous Message | REST / gRPC Request | Represents a blocking HTTP call requiring a response. |
| Asynchronous Message | Event Publication / Queue | Represents fire-and-forget messaging patterns. |
| Return Message | HTTP Response / Callback | Indicates the completion of the request with status data. |
| Alt Fragment | Conditional Logic / Fallback | Shows alternative paths based on service health or data. |
Using these adapted components ensures that the diagram remains a valid representation of the runtime behavior. It prevents the disconnect between the design document and the actual code execution.
⚡ Modeling Synchronous Communication
Synchronous communication occurs when a service sends a request and waits for a response before proceeding. This is common in RESTful APIs and gRPC calls. In a sequence diagram, this is represented by a solid line with an arrowhead pointing to the recipient.
When drawing these flows, developers should focus on the following details:
- Request Context: Include the HTTP method (GET, POST, PUT, DELETE) on the message label.
- Headers: Mention critical headers like Authentication Tokens or Trace IDs.
- Response Codes: Indicate expected status codes (200 OK, 401 Unauthorized, 500 Server Error).
- Timeouts: If a timeout is configured, it should be noted on the interaction.
Consider a scenario where a Order Service calls a Payment Service. The sequence diagram should show the Order Service sending a POST request. It then enters an activation state, waiting for the Payment Service. Once the Payment Service processes the transaction, it returns a response. If the Payment Service is unavailable, the diagram should show the error path.
It is crucial to label the return message clearly. Instead of just saying “Response”, specify “Payment Success” or “Payment Declined”. This distinction helps developers understand the business logic flow without reading the code.
🔄 Modeling Asynchronous Communication
Asynchronous communication is vital for scalability. In this pattern, a service sends a message and does not wait for an immediate response. This is typical in event-driven architectures using message brokers or event buses. The diagram representation changes to a dashed line with an arrowhead.
Key considerations for asynchronous flows include:
- Event Publishing: The sender publishes an event to a topic or queue.
- Event Consumption: The receiver subscribes to the topic and processes the event later.
- Decoupling: The sender and receiver do not need to be online simultaneously.
- Idempotency: Diagrams should imply that processing the same event twice should not cause errors.
When visualizing this, ensure the timeline shows a gap between the send and receive events. This visual gap represents the latency introduced by the message broker. It reminds the reader that the state change is not immediate.
For example, an Inventory Service might publish an ItemSold event. The Notification Service and Analytics Service both consume this event. The diagram should show the Inventory Service sending the event, and then branching out to show the other services reacting independently.
🛑 Handling Concurrency and Timeouts
Concurrent requests and timeouts are common sources of bugs in distributed systems. A sequence diagram must capture these scenarios to prevent optimistic assumptions about system behavior.
Timeout Handling
Every network call has a limit. If a service does not respond within this limit, the caller must act. In the diagram, this is often represented using an Alt (Alternative) fragment.
- Path A: The response arrives within the timeout window. The flow continues normally.
- Path B: The response does not arrive. The system triggers a fallback or error handling routine.
By explicitly mapping the timeout path, developers are reminded to implement retry logic or circuit breakers in the code. It prevents the assumption that the network is always fast and reliable.
Concurrency
Multiple requests may hit the same service simultaneously. While a sequence diagram is primarily sequential, it can indicate concurrency using parallel fragments. This is useful when showing that a parent request triggers multiple child requests that execute in parallel.
- Parallel Activation: Show multiple activation bars starting at the same time.
- Aggregation: Show when the results are combined back into the parent flow.
This helps identify potential race conditions or resource exhaustion issues. For instance, if a dashboard fetches data from five different services in parallel, the diagram shows this load on the infrastructure.
📝 Best Practices for Maintaining Diagrams
A diagram that is not maintained becomes technical debt. It misleads new developers and creates confusion during code reviews. To keep diagrams useful, adhere to the following practices:
- Keep it High-Level: Do not diagram every method call. Focus on the boundary between services.
- Update with Code: Treat the diagram as part of the codebase. If the API changes, the diagram must change.
- Use Standard Notation: Stick to standard UML symbols so that any developer can read them.
- Document Assumptions: If a diagram assumes a specific network speed or retry count, note it in the legend.
- Version Control: Store diagrams in the same repository as the code to ensure they evolve together.
Over-complicating a diagram with internal logic details makes it unreadable. The goal is to show the interaction, not the implementation. Internal logic belongs in the code comments or unit tests.
🚫 Common Pitfalls to Avoid
Even experienced developers make mistakes when modeling microservices. Identifying these pitfalls early can save significant debugging time later.
- Assuming Synchronous by Default: Many diagrams default to solid lines. Developers must consciously choose dashed lines for events.
- Ignoring Error Paths: Only showing the “Happy Path” gives a false sense of security. The diagram must show how the system handles failures.
- Missing Context: Forgetting to show authentication or data transformation steps can lead to security gaps.
- Too Many Services: A single diagram should not cover the entire system. Break it down by domain or feature.
- Static Lifelines: Ensure lifelines represent running instances, not just static classes. Microservices are dynamic and can scale.
🔄 Integrating Diagrams into CI/CD
To ensure diagrams remain accurate, they should be integrated into the Continuous Integration and Continuous Deployment pipeline. This process validates that the documentation matches the code.
Automated checks can verify that API endpoints defined in the diagram exist in the codebase. If a new endpoint is added to the code, the CI process should alert the team to update the diagram. This creates a feedback loop that enforces documentation hygiene.
Additionally, diagram rendering tools can be used to generate visual assets for the deployment pipeline. This ensures that the documentation published in the wiki or portal is always up to date with the latest build.
🎯 Conclusion on Implementation
Creating UML sequence diagrams for microservices requires a shift in mindset from object-oriented design to distributed system design. The focus moves from method calls to network messages, and from memory to state. By adhering to specific modeling standards and acknowledging the realities of network latency and failure, developers can create diagrams that serve as reliable blueprints.
These diagrams act as a communication bridge between architects, developers, and operations teams. They clarify expectations and define boundaries. When maintained with discipline, they reduce onboarding time for new team members and streamline the debugging process during incidents.
The effort invested in accurate diagramming pays dividends in system stability. It transforms abstract interactions into concrete, visual contracts. As the architecture evolves, the diagrams evolve with it, ensuring that the documentation remains a living asset rather than a static artifact.
Start small. Diagram one critical flow. Validate it against the running system. Expand gradually. This iterative approach ensures that the diagrams remain accurate and useful throughout the lifecycle of the microservice ecosystem.