


Understanding the internal architecture of a complex system is often where many design efforts falter. While standard class diagrams show how objects relate, they rarely reveal how a single classifier is constructed from the inside out. This is where the Composite Structure Diagram becomes an indispensable tool for system architects and developers. It provides a clear view of the internal structure, focusing on the composition of parts, their roles, and the interfaces that bind them together.
When designing robust software or hardware systems, knowing the external behavior is not enough. You must understand the internal wiring. This guide explores the mechanics of this diagram type, breaking down its syntax, semantics, and practical applications without the clutter of unnecessary jargon.
🧠 What Exactly Is a Composite Structure Diagram?
A Composite Structure Diagram is a type of UML (Unified Modeling Language) diagram that shows the internal structure of a classifier. It illustrates how a complex object is built from smaller components. Unlike a class diagram that focuses on inheritance and generalization, this diagram focuses on composition and aggregation.
It is particularly useful when:
- ✅ You need to visualize the internal parts of a class.
- ✅ You are designing systems with complex collaborations between parts.
- ✅ You need to define how parts interact internally without exposing the outside world.
- ✅ You are modeling hardware components or software modules that have strict internal boundaries.
This diagram allows you to see the structure rather than just the behavior. It answers the question: “What pieces make up this specific element, and how do they fit together?”
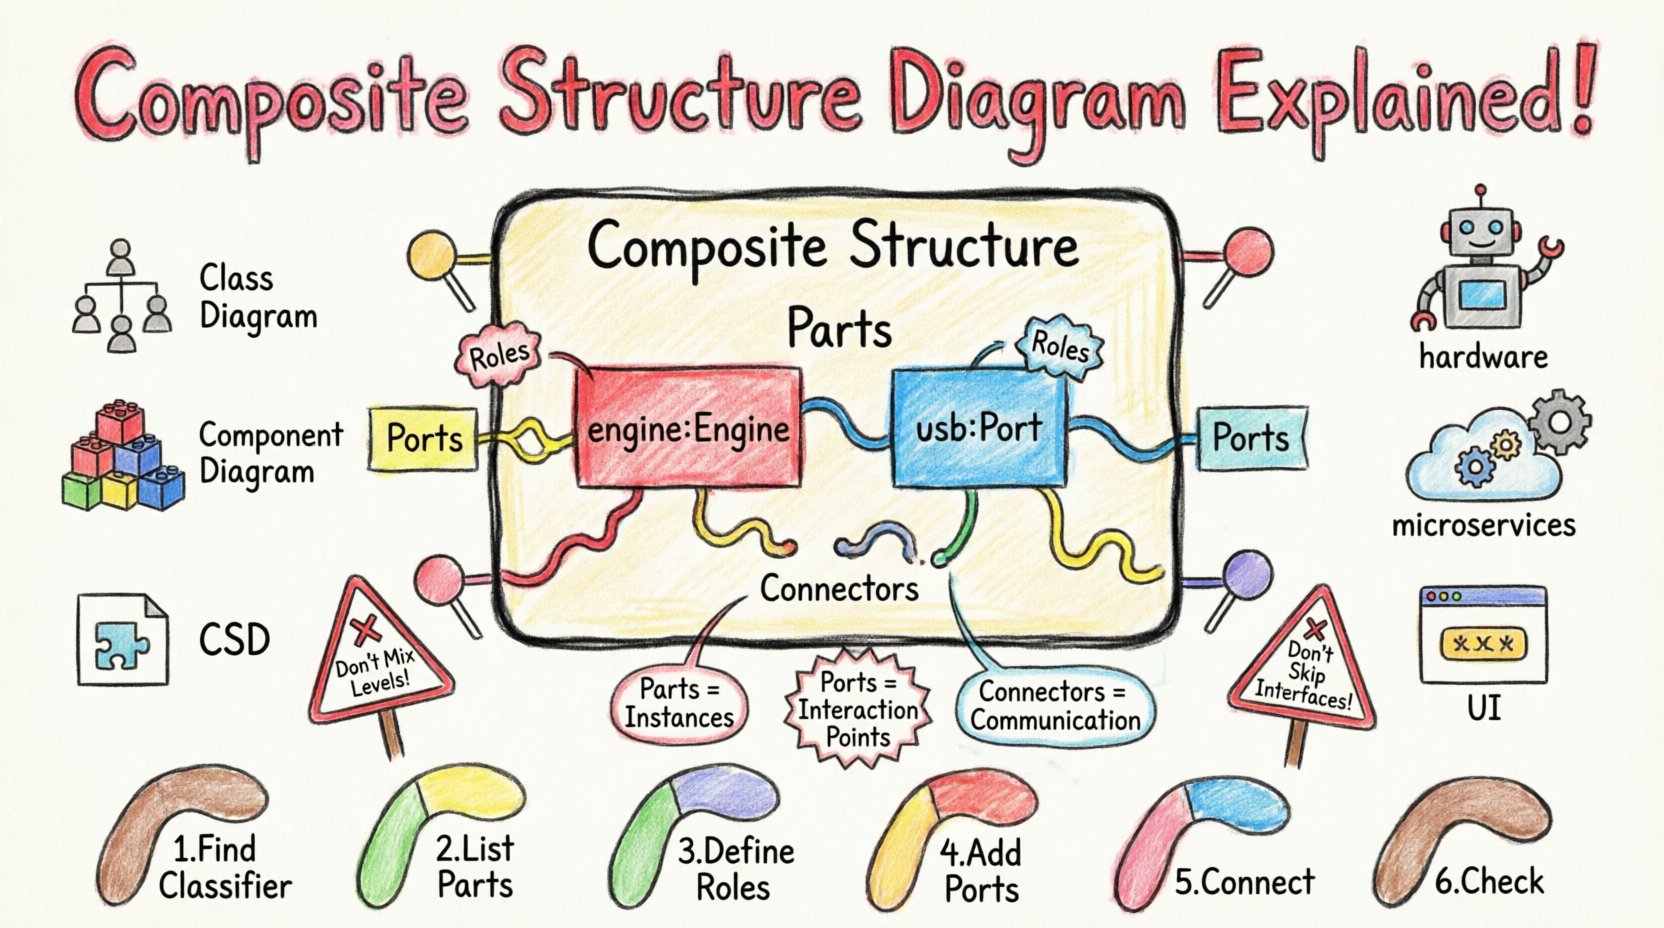
🏗️ Core Anatomy of the Diagram
To draw an effective diagram, you must understand the specific symbols and terminology used. Each element serves a distinct purpose in defining the topology of the system.
1. Parts and Instances
Parts represent the specific instances of classifiers that reside within the boundary of a composite structure. If you have a class called Car, a part within that structure might be an instance of the Engine class. This is not a general relationship; it is a specific composition.
- Notation: A rectangle with the part name and type (e.g.,
engine: Engine). - Role: Often, a part plays a specific role within the whole.
2. Roles
A role defines how a part participates in the structure. A single part might play multiple roles depending on how it connects to other parts or interfaces. Roles clarify the responsibility of a component within the composite.
- Example: A
USB_Portpart might play the role ofInput_DeviceorOutput_Device. - Benefit: It separates the identity of the part from its function in the current context.
3. Ports
Ports are the interaction points of a composite structure. They define where a part can receive or send signals. Think of ports as the electrical connectors on a motherboard.
- Providing Interface: The part offers a service (e.g., a printer port offering print services).
- Required Interface: The part needs a service to function (e.g., a screen requiring a video signal).
- Visual: Represented as small rectangles attached to the boundary of the part.
4. Connectors
Connectors link parts to each other. They define the communication path between ports. In a physical sense, this is the wire; in a software sense, this is the method call or message passing.
- Internal Connectors: Connect parts within the same composite structure.
- External Connectors: Connect a port on the composite structure to the outside world.
📊 Visual Syntax and Notation
Consistency in notation ensures that anyone reading the diagram understands the architecture immediately. The following table outlines the standard visual elements.
| Element | Visual Representation | Meaning |
|---|---|---|
| Composite Structure | Large Rectangle | The boundary of the classifier being defined. |
| Part | Smaller Rectangle inside | An instance of a classifier within the structure. |
| Port | Small Tab on the edge | An interaction point for external connections. |
| Connector | Line between ports | The link allowing data or control flow. |
| Role | Text label near connector | The function of the part in the connection. |
⚖️ Comparison: CSD vs. Class vs. Component Diagrams
Confusion often arises because UML offers several ways to model structure. Distinguishing when to use a Composite Structure Diagram (CSD) versus a Class Diagram or Component Diagram is critical for clean documentation.
- Class Diagram: Focuses on types, attributes, and methods. It defines what an object is, not necessarily how it is built internally.
- Component Diagram: Focuses on deployment and software modules. It is higher-level, often ignoring the internal composition of a component.
- Composite Structure Diagram: Focuses on the internal wiring of a single classifier. It is the most detailed regarding internal composition.
When to choose CSD: Use it when the internal arrangement of parts affects the system’s behavior significantly. If you need to show that a Database class actually contains a Cache part and a Logger part that communicate via specific interfaces, a CSD is the correct choice.
🚀 Practical Use Cases
While theoretical, these diagrams solve real-world engineering problems. Here are scenarios where they add immediate value.
1. Hardware-Software Integration
In embedded systems, software must talk to physical drivers. A CSD can show a Controller class containing a part named MotorDriver that connects via a Serial_Port. This clarifies the dependency between the code and the physical hardware.
2. Microservices Architecture
Even in distributed systems, individual services have internal structures. A service might contain a RequestHandler, a Validator, and a CacheManager. A CSD maps how these internal modules collaborate to process a request before returning a response.
3. Complex UI Components
Graphical user interfaces often have nested structures. A Window component is composed of a MenuBar, a Toolbar, and a ContentPane. Each of these has its own ports for user interaction. A CSD visualizes this hierarchy clearly.
🛠️ Designing a Composite Structure Diagram: Step-by-Step
Creating these diagrams requires a disciplined approach. Follow this workflow to ensure accuracy and clarity.
- Identify the Classifier: Start with the class or object that needs internal decomposition.
- List Internal Parts: Determine which instances reside inside. Are they mandatory? Are they optional?
- Define Roles: Assign a role to each part. What does this part do for the whole?
- Establish Interfaces: What services does the composite provide? What services does it require?
- Connect the Parts: Draw internal connectors between the ports of the parts.
- Validate: Check if every required interface is satisfied by a provided interface within the structure.
Pro Tip: Do not try to draw the entire system in one diagram. Break it down by major subsystems. A single diagram should focus on the internal structure of one primary classifier.
🧩 Advanced Concepts: Nesting and Lifelines
As systems grow, simple diagrams may become insufficient. Advanced features allow for deeper modeling.
1. Nested Classifiers
Parts themselves can have internal structures. You can nest a composite structure diagram inside another. This is useful for showing that a Engine part is itself made of Pistons and a Cylinder. However, avoid excessive nesting, as it can lead to visual clutter.
2. Lifelines
While typically associated with sequence diagrams, lifelines can appear in CSDs to indicate time-based behavior or interaction contexts for specific parts. This adds a temporal dimension to the structural view.
3. Collaboration Diagrams
Often, a composite structure diagram is derived from a collaboration diagram. The collaboration shows how objects interact, and the composite structure shows where those objects live internally. They complement each other perfectly.
🚫 Common Pitfalls to Avoid
Even experienced designers make mistakes when modeling internal structures. Being aware of these traps saves time and confusion.
- ❌ Mixing Levels of Abstraction: Do not mix high-level component diagrams with low-level part diagrams. Keep the granularity consistent.
- ❌ Ignoring Interfaces: If you connect parts without defining ports/interfaces, the connection is ambiguous. Always specify the interface type.
- ❌ Over-Engineering: Not every class needs a composite structure diagram. Use it only when the internal composition is complex enough to warrant it.
- ❌ Ignoring Multiplicity: A part can be 0..1, 1..*, or *..*. Specify how many instances of a part can exist within the composite.
🔍 Integration with Other Diagrams
A diagram does not exist in isolation. The Composite Structure Diagram links to other UML artifacts to provide a complete picture.
- Class Diagram: The parts in a CSD are defined by classes in the Class Diagram. Ensure the class definitions match.
- State Machine Diagram: A part within the composite might have its own state machine. The CSD shows where that state machine lives.
- Sequence Diagram: The connectors in the CSD often correspond to the message exchanges in a sequence diagram. Use them together to trace a message from entry to internal processing.
🛡️ Best Practices for Maintenance
Once a diagram is created, it becomes part of the living documentation. Keeping it up-to-date is essential.
- Version Control: Treat diagrams like code. Store them in version control to track changes over time.
- Consistent Naming: Use the same naming conventions for parts and ports across all diagrams. This aids searchability and understanding.
- Documentation Notes: Use notes to explain complex connections. A diagram should not rely solely on visual intuition for obscure logic.
- Review Cycles: During design reviews, specifically ask if the internal structure matches the implementation. Refactor the diagram if the code changes.
📝 Summary of Key Takeaways
The Composite Structure Diagram is a specialized tool for revealing the internal mechanics of a system. It bridges the gap between abstract class definitions and concrete implementation details. By focusing on parts, roles, ports, and connectors, it provides a blueprint for complex compositions.
Key points to remember:
- ✅ It visualizes the internal structure of a classifier.
- ✅ Parts represent instances within the structure.
- ✅ Ports define interaction points (providing/required).
- ✅ Connectors link parts internally.
- ✅ It complements Class and Component diagrams but serves a unique purpose.
When used correctly, this diagram reduces ambiguity in system design. It ensures that developers understand not just the inputs and outputs of a module, but the internal machinery that makes it work. This clarity leads to fewer bugs, easier maintenance, and more scalable architectures.
🔎 Frequently Asked Questions
Can I use a Composite Structure Diagram for database schemas?
Yes, but with caveats. You can model a table as a composite structure where rows are instances and columns are parts. However, standard Entity-Relationship diagrams are usually preferred for database schemas.
Does this diagram replace a Component Diagram?
No. A Component Diagram shows deployment and high-level modules. A Composite Structure Diagram shows the internal makeup of a specific module. They work together.
What tools should I use?
Any standard UML modeling tool supports this diagram type. The choice of tool is less important than the clarity of the model itself.
Is this diagram mandatory for every project?
No. For simple systems, a class diagram is sufficient. Use CSDs when the internal complexity justifies the overhead.
How do I handle polymorphism in this diagram?
Polymorphism is handled through the interfaces provided by the ports. A part can be of a superclass type but provide the same interface as a subclass. The connector relies on the interface, not the concrete class.
🌐 Final Thoughts
Designing software is about managing complexity. The Composite Structure Diagram is a powerful method to manage the complexity of internal relationships. By explicitly defining how parts fit together, you create a contract between the internal implementation and the external interface. This separation of concerns is the foundation of maintainable systems.
Take the time to model your internal structures accurately. The effort invested in drawing these diagrams pays dividends during the development and debugging phases. Clarity wins over speed in the long run. Build with precision, and your systems will reflect that stability.