


Visualizing hierarchical data—whether it is a complex project plan, a family tree, or a software architecture—has traditionally required a trade-off between speed and detail. Manual diagramming tools offer control but are time-consuming, while simple list-making apps lack visual context. The AI Tree Diagram Maker bridges this gap by combining a text-based editor with a real-time visualizer, supercharged by a suite of artificial intelligence features. in this review, we explore how this tool functions, its key AI capabilities, and who stands to benefit the most from its unique workflow.
Unpacking the AI Tree Diagram Maker
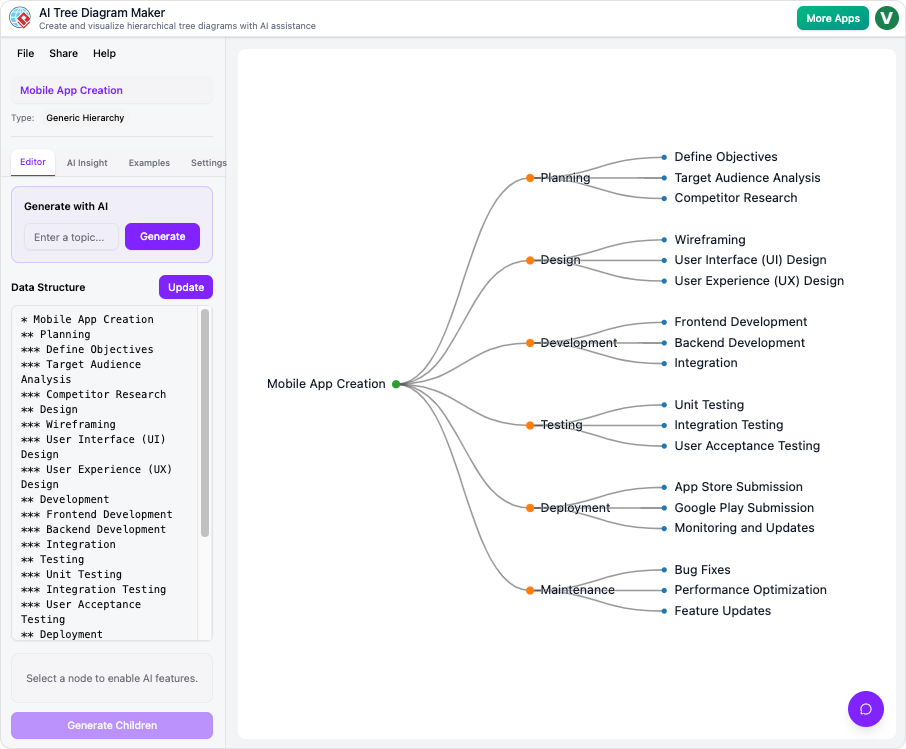
At its core, the AI Tree Diagram Maker is an interactive studio designed to generate, visualize, and analyze structured data. Unlike traditional drag-and-drop editors, this tool utilizes a dual-view interface. On the left, users work within a simple text editor; on the right, a beautiful diagram updates in real-time. This synchronization allows for rapid brainstorming without the friction of manually aligning nodes and connectors.
However, the standout value proposition is the integration of generative and analytical AI. The application does not just draw what you type; it helps you think. It can generate entire structures from a single prompt, analyze your plan for weaknesses, and even answer questions about your data through a conversational interface.
Key Features and AI Capabilities
1. Generative AI for Rapid Structure
Starting from a blank slate is often the hardest part of planning. The tool’s “Generate Full Tree” feature addresses this by creating a complete, structured diagram from a simple text description. For example, typing “Plan a company offsite event” prompts the AI to build a comprehensive Work Breakdown Structure (WBS) containing phases like logistics, catering, and agenda planning.
For users who already have a partial structure, the Generate Children feature allows for targeted expansion. By selecting a specific node, the AI can flesh out just that branch, adding detailed sub-tasks or sub-components instantly. This feels remarkably like having a brainstorming partner who handles the heavy lifting of detailing.
2. AI Insight and Analysis
One of the most innovative features is the AI Insight tab. Most diagramming tools are passive; they simply display data. The AI Tree Diagram Maker, however, can read and interpret your diagram. It provides a written analysis that summarizes the project, highlights potential risks or bottlenecks, and offers suggestions for improvement. This feature acts as a “second opinion,” helping Project Managers and Business Analysts spot gaps in their logic before execution begins.
3. The Context-Aware Chatbot
As diagrams grow complex, finding specific information can become difficult. The built-in AI Chatbot turns the diagram into a queryable database. Users can ask questions in plain English, such as “Which tasks are assigned to John?” or “Show me all high-risk items.” Because the chatbot understands the specific context of the nodes and their properties, it retrieves answers instantly, eliminating the need to manually hunt through branches.
The User Experience: Workflow and Blueprints
The application relies on a system of Blueprints—templates designed for specific use cases like Work Breakdown Structures, Decision Trees, or Family Trees. These blueprints are crucial because they define the metadata available in the Property Editor.
For instance, creating a WBS involves the following workflow:
- Selection: The user selects the WBS blueprint.
- Generation: The user prompts the AI to generate a plan for a new mobile app.
- Refinement: The AI builds phases for Design, Dev, and Testing. The user clicks a task node.
- Detailing: In the Property Editor panel, the user assigns the task to a team member and sets the status to “To Do.”
- Visualization: The user collapses completed branches to focus on active work.
This workflow highlights the tool’s strength: it moves seamlessly from high-level ideation to granular data management.
Pros and Cons
To provide a balanced review, it is essential to look at both the strengths and limitations of the platform.
The Pros
- Speed: The text-to-diagram workflow is significantly faster than drag-and-drop alternatives.
- AI Utility: The AI does not just generate text; it provides genuine analytical value through risk assessment and querying.
- Accessibility: The interface is intuitive, making it easy for students and educators to break down complex subjects.
- Cloud Convenience: Projects are saved to the cloud, allowing for easy sharing and exporting as images.
The Cons
- Strict Hierarchy: The tool is optimized for trees. It is not suitable for network graphs or webs with circular relationships.
- Connectivity: An active internet connection is required for all AI features and saving.
- Auto-Layout: While the automatic layout ensures tidiness, users cannot manually drag nodes to arbitrary positions, which may frustrate those who want pixel-perfect control.
Who Is This Tool For?
The AI Tree Diagram Maker is versatile, but it is particularly potent for specific professionals:
- Project Managers: For creating WBS, tracking task status, and identifying project risks early.
- Software Architects: For outlining component hierarchies and feature dependencies.
- Business Analysts: For mapping decision trees and organizational charts.
- Writers and Researchers: For structuring narratives and complex arguments.
Final Verdict
The AI Tree Diagram Maker transforms the static process of drawing into a dynamic process of creating. By leveraging AI not just for creation but for analysis and interaction, it elevates the humble tree diagram into a powerful project management and thinking tool. While it may not replace free-form whiteboard tools for unstructured brainstorming, it is a superior choice for anyone who needs to organize thoughts, tasks, or data into a clear, logical hierarchy.
For those ready to streamline their planning process, the tool is available to try immediately at Visual Paradigm’s AI Tree Diagram Maker.