
Mastering Visual Modeling: A Deep Dive into VPasCode and Use Case Diagrams
In the rapidly evolving landscape of software engineering, the gap between design and implementation is often bridged by modeling languages. However, traditional diagramming tools can sometimes become bottlenecks, requiring tedious manual manipulation of shapes and connectors. Enter VPasCode, a platform that leverages the diagram-as-code paradigm to streamline visual modeling. This tutorial explores how VPasCode transforms a textual description into a complex visual diagram, specifically analyzing a Customer Support System use case.
What is VPasCode?
VPasCode is an innovative tool developed by Visual Paradigm that applies the principles of “diagram-as-code” to visual modeling. Instead of relying on a mouse to drag and drop shapes onto a canvas, developers and architects describe the diagram using a structured text language. The platform then parses this text and renders it into a high-quality visual diagram.
This approach offers several distinct advantages:
- Version Control: Text-based diagrams can be stored in Git, allowing for diff tracking and collaboration.
- Efficiency: Generating complex structures is faster via code than via manual drawing.
- Consistency: The rendering engine ensures that styling and alignment are handled programmatically.
Understanding the Use Case Diagram
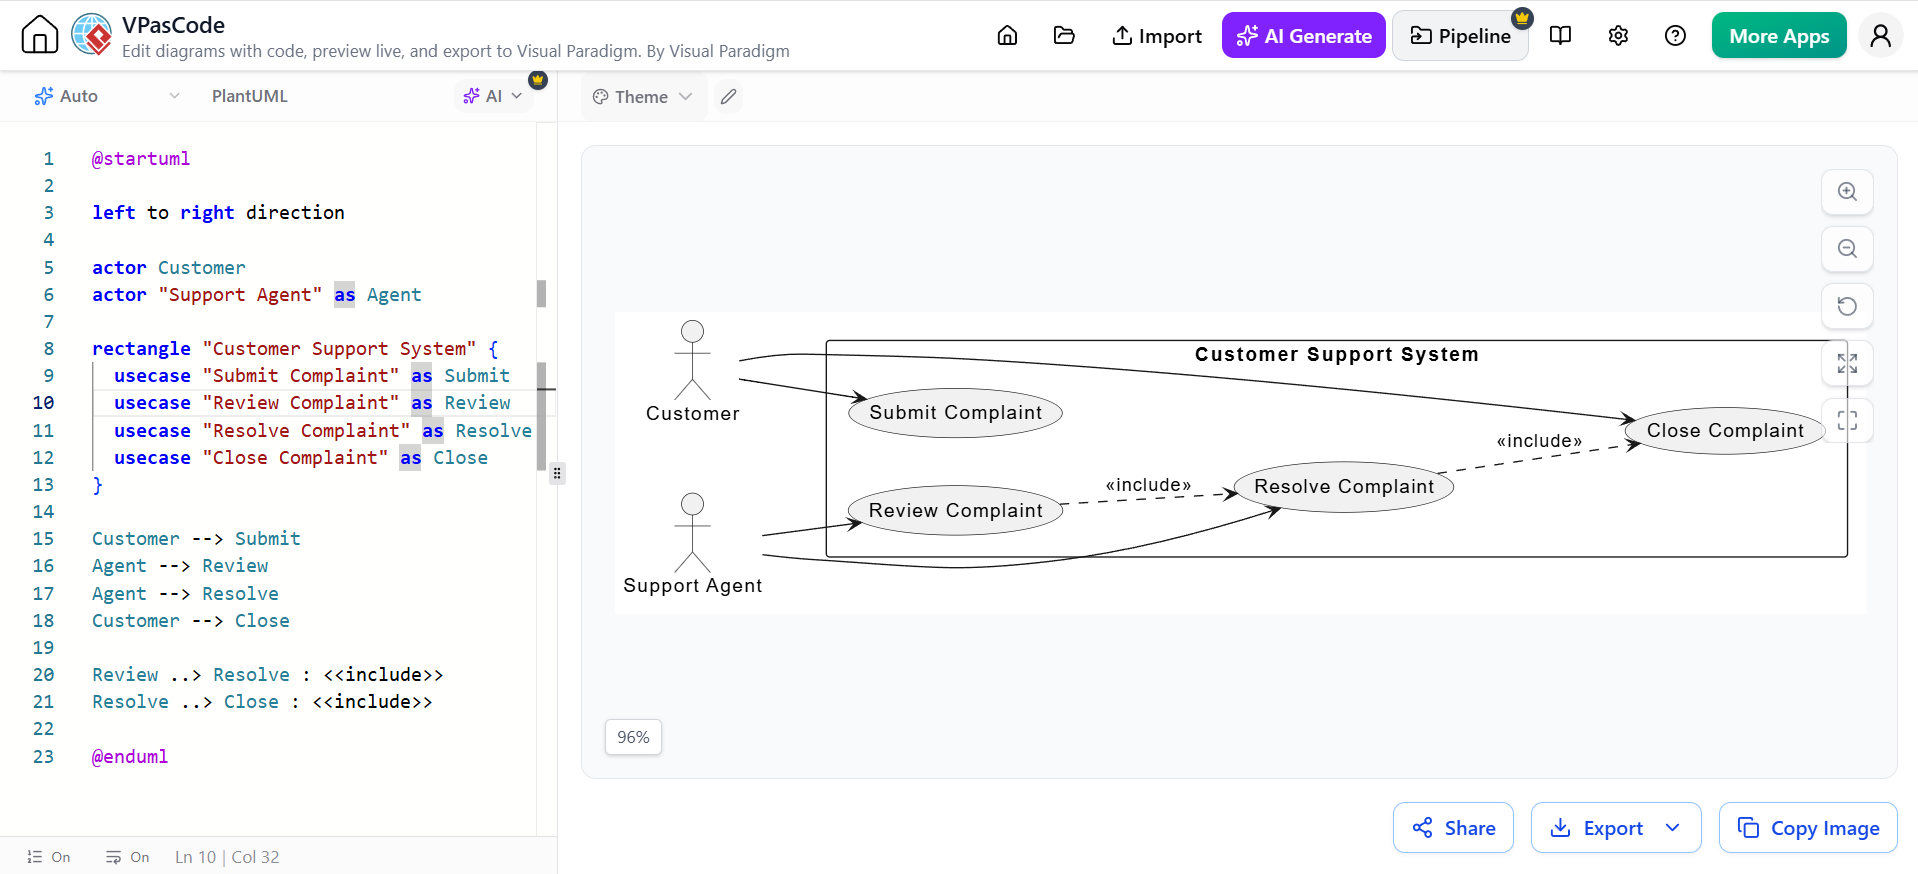
The screenshot provided demonstrates a classic Use Case Diagram. In software engineering, this diagram is used to describe the functional requirements of a system. It identifies actors (users or external systems) and use cases (the specific actions or functions the system performs).
Key Components
Based on the VPasCode interface, we can break down the diagram into three primary architectural elements:
- Actors: Represented by stick figures. In our example, these are the Customer and the Support Agent.
- System Boundary: The large rectangle labeled “Customer Support System” defines the scope. Everything inside is part of the system; everything outside interacts with it.
- Use Cases: Represented by ovals (e.g., “Submit Complaint”, “Resolve Complaint”).
Step-by-Step: From Text to Visual
Let’s walk through the code snippet shown in the editor pane on the left of the image to understand how the visual output on the right is generated.
1. Defining the Layout
The diagram begins with global settings that dictate the flow of the chart. The code left to right direction instructs the rendering engine to arrange actors on the left and use cases on the right, creating a clean, readable horizontal flow.
2. Declaring Actors
Actors are defined using the actor keyword. VPasCode allows for standard naming or custom labels:
actor Customer: Creates a standard stick figure labeled “Customer”.actor "Support Agent" as Agent: Defines an actor with a custom label (“Support Agent”) and creates a shorthand alias (Agent) for easier reference later in the code.
3. Grouping and Scope
The system boundary is created using a rectangle block. This encapsulates the specific use cases belonging to this system:
 rectangle "Customer Support System" {
   usecase "Submit Complaint" as Submit
   usecase "Review Complaint" as Review
   usecase "Resolve Complaint" as Resolve
   usecase "Close Complaint" as Close
 }
Inside this block, we define four distinct functions. Notice the use of aliases (e.g., as Submit). This is a crucial step for writing clean code, as it allows us to refer to “Submit” later without retyping the full string.
4. Establishing Relationships (Associations)
The next step is to connect the actors to the use cases they interact with. VPasCode uses arrow syntax to define these links:
Customer --> Submit: A solid arrow indicates the Customer initiates the “Submit Complaint” process.Agent --> Review&Agent --> Resolve: The Support Agent is linked to reviewing and resolving complaints.Customer --> Close: The Customer also has a direct relationship to the “Close Complaint” action.
5. Modeling Logic: The Include Relationship
One of the most powerful features in UML is the ability to show dependencies between use cases. In the code, we see:
Review ..> Resolve : <
Resolve ..> Close : <
The double-dot arrow (..>) combined with the label <<include>> signifies an Include Relationship. This means that the “Review Complaint” process must involve “Resolve Complaint,” and “Resolve Complaint” must involve “Close Complaint.” It represents a mandatory modularization of logic.
Why Use Diagram-as-Code?
The image highlights a split-screen interface. On the left, the text is editable and structured. On the right, the diagram is rendered instantly. This separation of concerns is the essence of VPasCode.
For a technical tutor, this method is invaluable because it:
- Encourages Precision: You cannot accidentally misplace a connector line in code; you simply write the relationship.
- Facilitates Collaboration: Teams can review diagram logic in pull requests just like they review source code.
- Reduces Technical Debt: Diagrams are often outdated because updating a drawing tool is slow. With code, updating a diagram is as easy as editing a string.
By adopting VPasCode, teams can ensure their system architecture documentation remains accurate, version-controlled, and easy to maintain.