
Mastering Complex Project Scheduling with Visual Paradigm PERT Charts
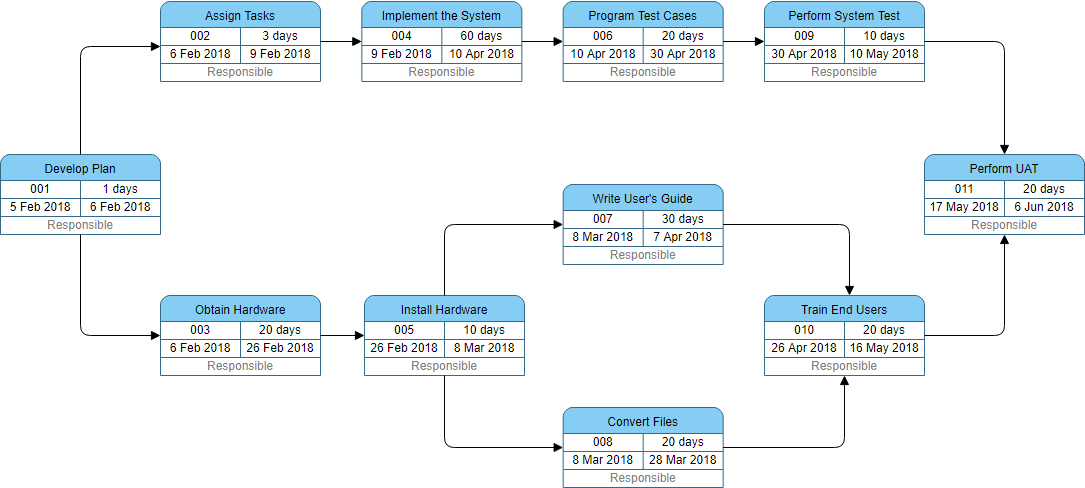
In the realm of enterprise software development and system implementation, managing timelines is often more critical than the code itself. The diagram presented above is a classic example of a Program Evaluation and Review Technique (PERT) Chart, specifically visualized within the Visual Paradigm environment. This diagram represents a “General Project Management” workflow, illustrating a complex initiative where multiple dependencies and parallel tracks converge.
This tutorial will deconstruct the architecture of this project schedule, explain the logic behind the critical path, and demonstrate how to model such a system effectively using modern project management tools.
Deconstructing the Project Architecture
The chart is organized into a network of nodes (tasks) connected by arrows (dependencies). It depicts a lifecycle that begins with planning and branches into hardware acquisition, software development, and user preparation, eventually converging for final testing and acceptance.
1. The Initiation Phase
The project commences with Task 001: Develop Plan. This is the root node of the project. In PERT logic, no other task can commence until this node is complete. It is a sequential start point, taking exactly 1 day (from Feb 5 to Feb 6).
2. Divergence: The Parallel Tracks
Immediately following the plan, the project splits into three distinct parallel tracks. This is a common strategy to optimize time-to-market by working on non-conflicting aspects of a project simultaneously:
- Track A (Top): Development Focus
- 002: Assign Tasks (3 days)
- 004: Implement the System (60 days) – This is the longest single task in the chart.
- 006: Program Test Cases (20 days)
- 009: Perform System Test (10 days)
- Track B (Bottom Left): Infrastructure Focus
- 003: Obtain Hardware (20 days)
- 005: Install Hardware (10 days)
- Track C (Bottom Center): Documentation & Training Focus
- 007: Write User’s Guide (30 days)
- 008: Convert Files (20 days)
- 010: Train End Users (20 days)
Understanding the Dependencies
The arrows in the diagram represent the “Finish-to-Start” relationship. For example, look at the bottom section of the chart. Task 005 (Install Hardware) is the predecessor. Once the hardware is installed (Task 005), the path splits again:
- It triggers Task 007 (Write User’s Guide). This implies the guide can be written based on the installed system configuration.
- It triggers Task 008 (Convert Files). This suggests data migration can only happen once the physical infrastructure is ready.
Furthermore, notice the convergence point at the end. Task 011: Perform UAT (User Acceptance Testing) is the final milestone. UAT cannot start until three separate streams are ready:
- The system has passed internal testing (from Task 009).
- The user documentation is ready (from Task 007).
- The users have been trained on the new system (from Task 010).
Technical Implementation in Visual Paradigm
To recreate this logic using Visual Paradigm or similar modeling tools, one must understand the specific attributes of the Node.
Node Anatomy
Each rectangular node in the chart is a composite object containing specific metadata required for Critical Path Method (CPM) calculations:
- Task ID: A unique identifier (e.g., 001, 002).
- Duration: The estimated time to complete the task (e.g., 60 days).
- Start Date: The calculated earliest start time (e.g., 6 Feb 2018).
- End Date: The calculated earliest finish time (e.g., 10 Apr 2018).
- Responsible: The stakeholder or role assigned to the task.
The Critical Path
In project management, the “Critical Path” is the longest sequence of tasks that determines the shortest possible duration of the project. If any task on this path is delayed, the entire project is delayed.
In this diagram, the critical path likely runs through the top section:
- Develop Plan (1 day)
- Assign Tasks (3 days)
- Implement the System (60 days)
- Program Test Cases (20 days)
- Perform System Test (10 days)
- Perform UAT (20 days)
The sum of these durations represents the project’s minimum timeline. Notice that Task 004 (Implement the System) is a massive bottleneck at 60 days. Any delay here directly impacts the Task 009 start date.
Best Practices for Modeling Schedules
When modeling complex projects like this, accuracy in dependencies is vital. A common error is creating “floating” tasks that have no logical link to the predecessor.
To ensure your PERT chart is robust:
- Validate Convergence: Ensure that tasks like UAT (Task 011) explicitly require all inputs (Software, Docs, Training).
- Review Parallelism: Ask if tasks like “Write User’s Guide” and “Train End Users” can truly happen in parallel, or if the guide must be finished before training begins.
- Dynamic Updates: In tools like Visual Paradigm, changing the duration of Task 004 should automatically recalculate the dates for Tasks 006, 009, and 011.