Introduction
In today’s rapidly evolving technology landscape, the ability to effectively design, communicate, and document complex software systems has become a critical differentiator for engineering teams. As organizations scale their digital initiatives and tackle increasingly sophisticated architectural challenges, the need for a standardized, visual approach to system modeling has never been more pressing. This case study explores the Unified Modeling Language (UML) not merely as a theoretical framework, but as a practical, industry-proven methodology that enables teams to bridge the gap between abstract requirements and concrete implementation.
 Implementation in Modern Software Development")
Through this comprehensive examination, we will trace UML’s evolution from fragmented modeling practices to a globally adopted standard, analyze its fourteen diagram types through real-world application scenarios, and demonstrate how modern tooling—including AI-powered generation capabilities—accelerates adoption while maintaining architectural rigor. Whether you are a seasoned architect evaluating modeling standards or a development team lead seeking to improve cross-functional collaboration, this guide provides actionable insights grounded in OMG standards and industry best practices.
1. Understanding UML: The Foundation of Visual System Design
The Unified Modeling Language (UML) is a standardized language designed for specifying, visualizing, constructing, and documenting the artifacts of software systems. Beyond software, UML is equally applicable to business modeling and other non-software domains. It represents a consolidated collection of proven engineering practices that have demonstrated success in modeling large, complex systems.
The Critical Role of Modeling
Modeling is foundational to successful system development, analogous to how a blueprint is essential before constructing a large building. Its core purposes include:
-
Communication: Provides a common visual language that aligns project teams, stakeholders, and domain experts.
-
Architectural Soundness: Ensures system structure is rigorously planned and validated before implementation.
-
Managing Complexity: As systems grow in scale and intricacy, robust modeling techniques become indispensable.
While many factors contribute to project success, adopting a rigorous, standardized modeling language is a critical enabler.

2. Historical Context & Standardization Journey
2.1 Industry Fragmentation & The Push for a Standard
Prior to UML, the modeling landscape was highly fragmented. Users faced numerous competing languages with only minor differences in expressive power. These variations did not significantly enhance modeling capabilities; instead, they:
-
Divided the object-oriented (OO) industry
-
Created unnecessary learning curves
-
Discouraged new adopters from embracing visual modeling
Practitioners strongly desired a single, broadly supported, general-purpose modeling language: a true lingua franca for the industry.
2.2 OMG’s Role in Standardization
For years, the OO analysis and design market stagnated due to intense debates among methodologists and vendors over processes, methods, and notations. In 1995, market consolidation and global methodologist support prompted the Object Management Group (OMG) to act. During a landmark meeting in Silicon Valley, the OMG convened leading methodologists and tool vendors, who unanimously agreed on two key points:
-
The industry required a worldwide standard for metamodeling and notation.
-
The OMG’s fast, consensus-driven, open process was the ideal framework to achieve this.
The result was the first major international standard for object-oriented modeling.
2.3 Founding Supporters
The technology adoption was submitted and supported by a coalition of industry leaders:
Rational Software, Microsoft, Hewlett-Packard, Oracle, Sterling Software, MCI Systemhouse, Unisys, ICON Computing, IntelliCorp, Telelogic, IBM, ObjecTime, Platinum Technology, Ptech, Taskon, Reich Technologies, and Softeam.
3. UML within the Object Management Architecture (OMA)
Traditionally, the OMG focused on infrastructure and layered, domain-specific standardized interfaces. UML marks a strategic broadening of this focus into system design. Despite this shift, UML aligns seamlessly with the OMA by:
-
Supporting the core OMG goals of interoperability and portability through standardized design technologies
-
Integrating naturally with standardized implementation architectures
-
Providing standardized pathways for requirements capture, systems analysis, and software design that complement CORBA-based implementation frameworks.
4. Transitioning from Legacy Modeling Methods
UML was not created in isolation; it synthesizes foundational concepts from established methodologies, primarily:
-
OMT (Object Modeling Technique)
-
Booch
-
OOSE (Object-Oriented Software Engineering)
Professionals trained in these legacy methods will transition to UML with minimal friction. While some training is required to achieve full productivity, the long-term advantages of working within a unified industry standard far outweigh the initial learning investment. Architects and developers retain the flexibility to apply UML alongside or in place of legacy notations without losing prior conceptual knowledge.
5. Tangible Benefits for Practitioners & Organizations
While UML does not automatically guarantee project success, it delivers measurable improvements across the development lifecycle:
-
Cost Reduction: Significantly lowers ongoing training and retooling expenses when developers move between projects or organizations.
-
Ecosystem Integration: Enables seamless interoperability between modeling tools, development processes, and domain-specific frameworks.
-
Business Focus: Provides a clear paradigm that helps developers shift attention from methodological debates to delivering tangible business value.
6. The Meta Object Facility (MOF) & UML’s Future
The Meta Object Facility (MOF) is a foundational OMG technology that provides a set of CORBA interfaces for defining and manipulating interoperable metamodels. Its relationship to UML includes:
-
Serving as a core building block for CORBA-based distributed development environments.
-
Enabling metadata interoperability in object analysis and design.
-
Providing an extensible framework expected to support additional domains over time, including:
-
Application development lifecycle metamodels
-
Data warehouse management
-
Business object management
-
The OMG plans to issue future Requests for Proposals (RFPs) to expand MOF capabilities into these emerging domains.
7. Governance, Maintenance & Evolution
To ensure UML remains relevant and accurate, the OMG established a structured governance model:
-
Minor Revisions: Managed by an OMG-appointed Revision Task Force that addresses necessary updates, clarifications, and refinements.
-
Major Revisions: Handled through the OMG’s open Request for Proposal (RFP) process, ensuring broad industry participation and consensus.
-
Continuity: Original technology submitters actively participate in revision efforts, preserving architectural intent while adapting to evolving industry needs.
8. The Origin of UML: Unifying Best Practices
The goal of UML is to provide a standard notation that can be used by all object-oriented methods and to select and integrate the best elements of precursor notations. UML has been designed for a broad range of applications. Hence, it provides constructs for a broad range of systems and activities (e.g., distributed systems, analysis, system design and deployment).
UML is a notation that resulted from the unification of:
-
Object Modeling Technique OMT [James Rumbaugh 1991] – was best for analysis and data-intensive information systems.
-
Booch [Grady Booch 1994] – was excellent for design and implementation. Grady Booch had worked extensively with the Ada language, and had been a major player in the development of Object Oriented techniques for the language. Although the Booch method was strong, the notation was less well received (lots of cloud shapes dominated his models – not very tidy)
-
OOSE (Object-Oriented Software Engineering [Ivar Jacobson 1992]) – featured a model known as Use Cases. Use Cases are a powerful technique for understanding the behaviour of an entire system (an area where OO has traditionally been weak).
In 1994, Jim Rumbaugh, the creator of OMT, stunned the software world when he left General Electric and joined Grady Booch at Rational Corp. The aim of the partnership was to merge their ideas into a single, unified method (the working title for the method was indeed the “Unified Method”).
By 1995, the creator of OOSE, Ivar Jacobson, had also joined Rational, and his ideas (particularly the concept of “Use Cases”) were fed into the new Unified Method – now called the Unified Modelling Language. The team of Rumbaugh, Booch and Jacobson are affectionately known as the “Three Amigos”
UML has also been influenced by other object-oriented notations:
-
Mellor and Shlaer [1998]
-
Coad and Yourdon [1995]
-
Wirfs-Brock [1990]
-
Martin and Odell [1992]
UML also includes new concepts that were not present in other major methods at the time, such as extension mechanisms and a constraint language.
9. Evolution Timeline of UML
-
During 1996, the first Request for Proposal (RFP) issued by the Object Management Group (OMG) provided the catalyst for these organizations to join forces around producing a joint RFP response.
-
Rational established the UML Partners consortium with several organizations willing to dedicate resources to work toward a strong UML 1.0 definition. Those contributing most to the UML 1.0 definition included:
-
Digital Equipment Corp
-
HP
-
i-Logix
-
IntelliCorp
-
IBM
-
ICON Computing
-
MCI Systemhouse
-
Microsoft
-
Oracle
-
Rational Software
-
TI
-
Unisys
-
-
This collaboration produced UML 1.0, a modeling language that was well-defined, expressive, powerful, and generally applicable. This was submitted to the OMG in January 1997 as an initial RFP response.
-
In January 1997 IBM, ObjecTime, Platinum Technology, Ptech, Taskon, Reich Technologies and Softeam also submitted separate RFP responses to the OMG. These companies joined the UML partners to contribute their ideas, and together the partners produced the revised UML 1.1 response. The focus of the UML 1.1 release was to improve the clarity of the UML 1.0 semantics and to incorporate contributions from the new partners. It was submitted to the OMG for their consideration and adopted in the fall of 1997 and enhanced 1.1 to 1.5, and subsequently to UML 2.1 from 01 to 06 (now the UML current version is 2.5)
10. Why UML Matters Today
As the strategic value of software increases for many companies, the industry looks for techniques to automate the production of software and to improve quality and reduce cost and time-to-market. These techniques include component technology, visual programming, patterns and frameworks. Businesses also seek techniques to manage the complexity of systems as they increase in scope and scale. In particular, they recognize the need to solve recurring architectural problems, such as physical distribution, concurrency, replication, security, load balancing and fault tolerance. Additionally, the development for the World Wide Web, while making some things simpler, has exacerbated these architectural problems. The Unified Modeling Language (UML) was designed to respond to these needs.
The primary goals in the design of the UML summarize by Page-Jones in Fundamental Object-Oriented Design in UML as follows:
-
Provide users with a ready-to-use, expressive visual modeling language so they can develop and exchange meaningful models.
-
Provide extensibility and specialization mechanisms to extend the core concepts.
-
Be independent of particular programming languages and development processes.
-
Provide a formal basis for understanding the modeling language.
-
Encourage the growth of the OO tools market.
-
Support higher-level development concepts such as collaborations, frameworks, patterns and components.
-
Integrate best practices.
11. The Next Evolution: AI-Powered UML Modeling
While UML provides the standard notation for system design, the way we build these models is changing. Visual Paradigm has integrated cutting-edge AI Diagram Generation to help you move from concept to complex architecture in seconds.
Streamline Your Design Workflow:
-
AI Diagram Chatbot: Simply describe your system requirements in plain English and watch your UML diagrams generate instantly. You can even ask follow-up questions to refine the logic.
-
Desktop AI Generator: Access powerful UML generation capabilities directly within the Visual Paradigm Desktop environment for professional-grade modeling.
-
OpenDocs Knowledge Management: Seamlessly embed AI-generated diagrams into your documentation to keep your technical knowledge base and visual models in perfect sync.
Explore the complete AI modeling ecosystem:
View AI Diagram Generation Guide →
12. UML Diagram Types: A Comprehensive Overview
Before we begin to look at the theory of the UML, we are going to take a very brief run through some of the major concepts of the UML.
The first thing to notice about the UML is that there are a lot of different diagrams (models) to get used to. The reason for this is that it is possible to look at a system from many different viewpoints. A software development will have many stakeholders playing a part.
For Example:
-
Analysts
-
Designers
-
Coders
-
Testers
-
QA
-
The Customer
-
Technical Authors
All of these people are interested in different aspects of the system, and each of them require a different level of detail. For example, a coder needs to understand the design of the system and be able to convert the design to a low level code. By contrast, a technical writer is interested in the behavior of the system as a whole, and needs to understand how the product functions. The UML attempts to provide a language so expressive that all stakeholders can benefit from at least one UML diagram.
Here’s a quick look at each one of these 13 diagrams in as shown in the UML 2 Diagram Structure below:

Structure Diagrams
Structure diagrams show the static structure of the system and its parts on different abstraction and implementation levels and how they are related to each other. The elements in a structure diagram represent the meaningful concepts of a system, and may include abstract, real world and implementation concepts, there are seven types of structure diagram as follows:
Behavior Diagrams
Behavior diagrams show the dynamic behavior of the objects in a system, which can be described as a series of changes to the system over time, there are seven types of behavior diagrams as follows:
13. Deep Dive: Structure Diagrams in Practice
What is a Class Diagram?
The class diagram is a central modeling technique that runs through nearly all object-oriented methods. This diagram describes the types of objects in the system and various kinds of static relationships which exist between them.
Relationships
There are three principal kinds of relationships which are important:
-
Association – represent relationships between instances of types (a person works for a company, a company has a number of offices).
-
Inheritance – the most obvious addition to ER diagrams for use in OO. It has an immediate correspondence to inheritance in OO design.
-
Aggregation – Aggregation, a form of object composition in object-oriented design.
Class Diagram Example

For more details about Class Diagram, please read the article What is Class Diagram?
What is Component Diagram?
In the Unified Modeling Language, a component diagram depicts how components are wired together to form larger components or software systems. It illustrates the architectures of the software components and the dependencies between them. Those software components including run-time components, executable components also the source code components.
Component Diagram Example

For more details about Component Diagram, please read the article What is Component Diagram?
What is a Deployment Diagram?
The Deployment Diagram helps to model the physical aspect of an Object-Oriented software system. It is a structure diagram which shows architecture of the system as deployment (distribution) of software artifacts to deployment targets. Artifacts represent concrete elements in the physical world that are the result of a development process. It models the run-time configuration in a static view and visualizes the distribution of artifacts in an application. In most cases, it involves modeling the hardware configurations together with the software components that lived on.
Deployment Diagram Example

For more details about Deployment Diagram, please read the article What is Deployment Diagram?
What is an Object Diagram?
An object diagram is a graph of instances, including objects and data values. A static object diagram is an instance of a class diagram; it shows a snapshot of the detailed state of a system at a point in time. The difference is that a class diagram represents an abstract model consisting of classes and their relationships. However, an object diagram represents an instance at a particular moment, which is concrete in nature. The use of object diagrams is fairly limited, namely to show examples of data structure.
Class Diagram vs Object Diagram – An Example
Some people may find it difficult to understand the difference between a UML Class Diagram and a UML Object Diagram as they both comprise of named “rectangle blocks”, with attributes in them, and with linkages in between, which make the two UML diagrams look similar. Some people may even think they are the same because in the UML tool they use both the notations for Class Diagram and Object Diagram are put inside the same diagram editor – Class Diagram.
But in fact, Class Diagram and Object Diagram represent two different aspects of a code base. In this article, we will provide you with some ideas about these two UML diagrams, what they are, what are their differences and when to use each of them.
Relationship between Class Diagram and Object Diagram
You create “classes” when you are programming. For example, in an online banking system you may create classes like ‘User’, ‘Account’, ‘Transaction’, etc. In a classroom management system you may create classes like ‘Teacher’, ‘Student’, ‘Assignment’, etc. In each class, there are attributes and operations that represent the characteristic and behavior of the class. Class Diagram is a UML diagram where you can visualize those classes, along with their attributes, operations and the inter-relationship.
UML Object Diagram shows how object instances in your system are interacting with each other at a particular state. It also represents the data values of those objects at that state. In other words, a UML Object Diagram can be seen as a representation of how classes (drawn in UML Class Diagram) are utilized at a particular state.
If you are not a fan of those definition stuff, take a look at the following UML diagram examples. I believe that you will understand their differences in seconds.
Class Diagram Example
The following Class Diagram example represents two classes – User and Attachment. A user can upload multiple attachment so the two classes are connected with an association, with 0..* as multiplicity on the Attachment side.

Object Diagram Example
The following Object Diagram example shows you how the object instances of User and Attachment class “look like” at the moment Peter (i.e. the user) is trying to upload two attachments. So there are two Instance Specification for the two attachment objects to be uploaded.

For more details about Object Diagram, please read the article What is Object Diagram?
What is a Package Diagram?
Package diagram is UML structure diagram which shows packages and dependencies between the packages. Model diagrams allow to show different views of a system, for example, as multi-layered (aka multi-tiered) application – multi-layered application model.
Package Diagram Example

For more details about Package Diagram, please read the article What is Package Diagram?
What is a Composite Structure Diagram?
Composite Structure Diagram is one of the new artifacts added to UML 2.0. A composite structure diagram is similar to a class diagram and is a kind of component diagram mainly used in modeling a system at micro point-of-view, but it depicts individual parts instead of whole classes. It is a type of static structure diagram that shows the internal structure of a class and the collaborations that this structure makes possible.
This diagram can include internal parts, ports through which the parts interact with each other or through which instances of the class interact with the parts and with the outside world, and connectors between parts or ports. A composite structure is a set of interconnected elements that collaborate at runtime to achieve some purpose. Each element has some defined role in the collaboration.
Composite Structure Diagram Example

For more details about Composite Structure Diagram, please read the article What is Composite Structure Diagram?
What is a Profile Diagram?
A profile diagram enables you to create domain and platform specific stereotypes and define the relationships between them. You can create stereotypes by drawing stereotype shapes and relate them with composition or generalization through the resource-centric interface. You can also define and visualize tagged values of stereotypes.
Profile Diagram Example

For more details about Profile Diagram, please read the article What is Profile Diagram in UML?
14. Deep Dive: Behavior Diagrams in Practice
What is a Use Case Diagram?
A use-case model describes a system’s functional requirements in terms of use cases. It is a model of the system’s intended functionality (use cases) and its environment (actors). Use cases enable you to relate what you need from a system to how the system delivers on those needs.
Think of a use-case model as a menu, much like the menu you’d find in a restaurant. By looking at the menu, you know what’s available to you, the individual dishes as well as their prices. You also know what kind of cuisine the restaurant serves: Italian, Mexican, Chinese, and so on. By looking at the menu, you get an overall impression of the dining experience that awaits you in that restaurant. The menu, in effect, “models” the restaurant’s behavior.
Because it is a very powerful planning instrument, the use-case model is generally used in all phases of the development cycle by all team members.
Use Case Diagram Example

For more details about Use Case Diagram, please read the article What is Use Case Diagram?
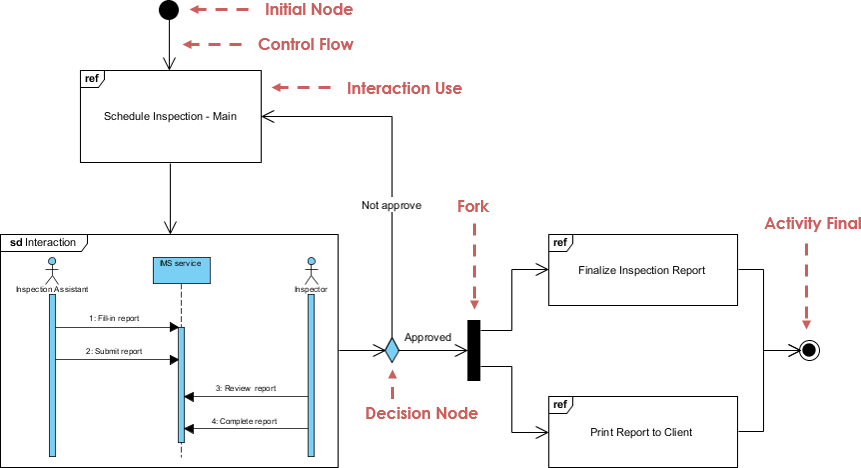
What is an Activity Diagram?
Activity diagrams are graphical representations of workflows of stepwise activities and actions with support for choice, iteration and concurrency. It describes the flow of control of the target system, such as the exploring complex business rules and operations, describing the use case also the business process. In the Unified Modeling Language, activity diagrams are intended to model both computational and organizational processes (i.e. workflows).
Activity Diagram Example

For more details about Activity Diagram, please read the article What is Activity Diagram?
What is a State Machine Diagram?
A state diagram is a type of diagram used in UML to describe the behavior of systems which is based on the concept of state diagrams by David Harel. State diagrams depict the permitted states and transitions as well as the events that effect these transitions. It helps to visualize the entire lifecycle of objects and thus help to provide a better understanding of state-based systems.
State Machine Diagram Example

For more details about State Machine Diagram, please read the article What is State Machine Diagram?
What is a Sequence Diagram?
The Sequence Diagram models the collaboration of objects based on a time sequence. It shows how the objects interact with others in a particular scenario of a use case. With the advanced visual modeling capability, you can create complex sequence diagram in few clicks. Besides, some modeling tool such as Visual Paradigm can generate sequence diagram from the flow of events which you have defined in the use case description.
Sequence Diagram Example
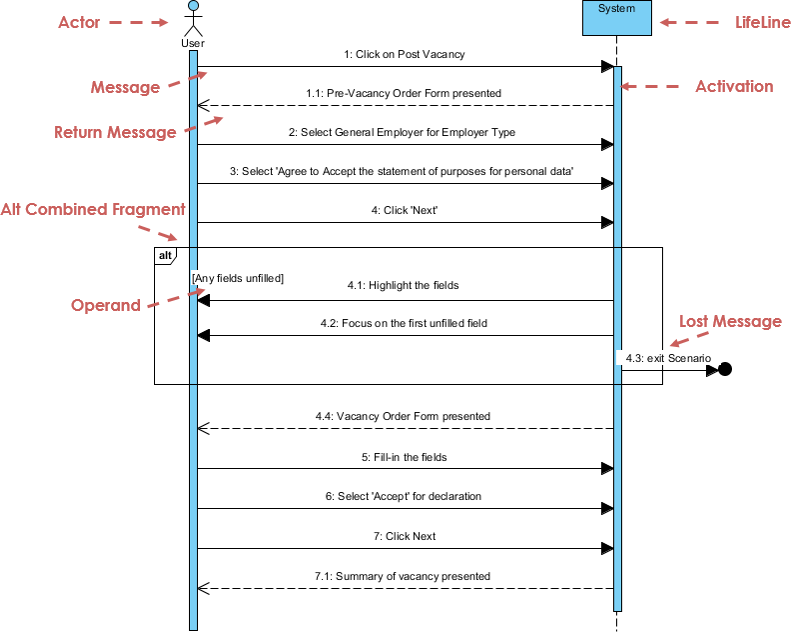
For more details about Sequence Diagram, please read the article What is Sequence Diagram?
What is a Communication Diagram?
Similar to Sequence Diagram, the Communication Diagram is also used to model the dynamic behavior of the use case. When compare to Sequence Diagram, the Communication Diagram is more focused on showing the collaboration of objects rather than the time sequence. They are actually semantically equivalent, so some of the modeling tool such as, Visual Paradigm allows you to generate it from one to the other.
Communication Diagram Example

For more details about Communication Diagram, please read the article What is Communication Diagram?
What is Interaction Overview Diagram?
The Interaction Overview Diagram focuses on the overview of the flow of control of the interactions. It is a variant of the Activity Diagram where the nodes are the interactions or interaction occurrences. The Interaction Overview Diagram describes the interactions where messages and lifelines are hidden. You can link up the “real” diagrams and achieve high degree navigability between diagrams inside the Interaction Overview Diagram.
Interaction Overview Diagram Example
For more details about Interaction Overview Diagram, please read the article What is Interaction Overview Diagram?
What is Timing Diagram?
Timing Diagram shows the behavior of the object(s) in a given period of time. Timing diagram is a special form of a sequence diagram. The differences between timing diagram and sequence diagram are the axes are reversed so that the time are increase from left to right and the lifelines are shown in separate compartments arranged vertically.
Timing Diagram Example

Conclusion: UML as a Strategic Asset for Modern Engineering Teams
The Unified Modeling Language represents far more than a collection of diagramming conventions—it embodies a mature, industry-validated approach to taming complexity in software-intensive systems. Born from the convergence of pioneering methodologies and refined through decades of global collaboration under the OMG’s stewardship, UML provides teams with a shared vocabulary that transcends organizational boundaries, technology stacks, and geographic distances.
Today’s engineering challenges—from distributed cloud architectures to AI-integrated applications—demand not just technical proficiency but architectural clarity. UML delivers this by enabling teams to visualize system structure before code is written, validate behavioral flows before deployment, and communicate design intent to stakeholders across technical and non-technical domains. When combined with modern tooling that supports round-trip engineering, AI-assisted generation, and cloud-based collaboration, UML transforms from a documentation exercise into a living design asset that evolves alongside the system it describes.
For organizations evaluating modeling standards, the decision is not whether to adopt UML, but how to integrate it most effectively into existing workflows. Start with high-impact diagrams like Use Cases for requirements alignment or Class Diagrams for API design. Leverage AI-powered tools to accelerate initial modeling efforts while maintaining OMG compliance. Most importantly, treat UML as a communication catalyst—not a bureaucratic checkpoint—and empower teams to select the diagram types that deliver the clearest value for their specific context.
As systems continue to grow in scale and interconnectedness, the disciplined thinking that UML encourages becomes not just advantageous, but essential. By investing in UML literacy and tooling today, engineering organizations position themselves to build more resilient, maintainable, and strategically aligned software for tomorrow.
References
-
Object Modeling Technique (OMT): Wikipedia article describing the Object Modeling Technique, one of the foundational methodologies that contributed to UML’s development.
-
James Rumbaugh: Wikipedia biography of James Rumbaugh, co-creator of OMT and one of the “Three Amigos” behind UML.
-
Grady Booch: Wikipedia biography of Grady Booch, creator of the Booch method and key contributor to UML standardization.
-
Ada Programming Language: Wikipedia article on the Ada language, which influenced Grady Booch’s object-oriented design approaches.
-
Ivar Jacobson: Wikipedia biography of Ivar Jacobson, creator of OOSE and Use Cases, and third member of the “Three Amigos.”
-
Object Management Group (OMG): Official website of the OMG, the standards consortium responsible for UML specification and governance.
-
UML History Timeline Visual: Visual timeline illustrating the evolution of UML from precursor methods to current standards.
-
AI Diagram Chatbot: Interactive AI tool for generating UML diagrams from natural language descriptions.
-
Desktop AI Generator Guide: Documentation for using AI-powered diagram generation within Visual Paradigm Desktop.
-
OpenDocs Knowledge Management: AI-enhanced documentation tool for synchronizing UML models with technical knowledge bases.
-
AI Diagram Generation Ecosystem Guide: Comprehensive overview of Visual Paradigm’s AI-assisted modeling capabilities.
-
Class Diagram Reference: Anchor link to Class Diagram section within Visual Paradigm’s UML guide.
-
Component Diagram Reference: Anchor link to Component Diagram section within Visual Paradigm’s UML guide.
-
Deployment Diagram Reference: Anchor link to Deployment Diagram section within Visual Paradigm’s UML guide.
-
Object Diagram Reference: Anchor link to Object Diagram section within Visual Paradigm’s UML guide.
-
Package Diagram Reference: Anchor link to Package Diagram section within Visual Paradigm’s UML guide.
-
Composite Structure Diagram Reference: Anchor link to Composite Structure Diagram section within Visual Paradigm’s UML guide.
-
Profile Diagram Reference: Anchor link to Profile Diagram section within Visual Paradigm’s UML guide.
-
Use Case Diagram Reference: Anchor link to Use Case Diagram section within Visual Paradigm’s UML guide.
-
Activity Diagram Reference: Anchor link to Activity Diagram section within Visual Paradigm’s UML guide.
-
State Machine Diagram Reference: Anchor link to State Machine Diagram section within Visual Paradigm’s UML guide.
-
Sequence Diagram Reference: Anchor link to Sequence Diagram section within Visual Paradigm’s UML guide.
-
Communication Diagram Reference: Anchor link to Communication Diagram section within Visual Paradigm’s UML guide.
-
Interaction Overview Diagram Reference: Anchor link to Interaction Overview Diagram section within Visual Paradigm’s UML guide.
-
Timing Diagram Reference: Anchor link to Timing Diagram section within Visual Paradigm’s UML guide.
-
UML Diagram Types Overview: Visual reference chart displaying all 14 UML 2.x diagram types categorized by structure and behavior.
-
Class Diagram Example: Sample Class Diagram illustrating object types, attributes, operations, and relationships.
-
What is Class Diagram?: Detailed guide explaining Class Diagram concepts, notation, and best practices.
-
Component Diagram Example: Sample Component Diagram showing software component architecture and dependencies.
-
What is Component Diagram?: Comprehensive reference for Component Diagram modeling techniques.
-
Deployment Diagram Example: Sample Deployment Diagram illustrating hardware-software artifact distribution.
-
What is Deployment Diagram?: Guide to modeling physical system architecture with Deployment Diagrams.
-
Class vs Object Diagram Comparison: Visual example contrasting abstract Class Diagram with concrete Object Diagram instances.
-
Object Diagram Example: Sample Object Diagram showing runtime instance state and data values.
-
What is Object Diagram?: Explanation of Object Diagram usage for illustrating system state snapshots.
-
Package Diagram Example: Sample Package Diagram demonstrating modular organization and dependencies.
-
What is Package Diagram?: Reference for organizing large models using Package Diagrams.
-
Composite Structure Diagram Example: Sample diagram showing internal class structure and part collaborations.
-
What is Composite Structure Diagram?: Guide to modeling internal class architecture with Composite Structure Diagrams.
-
Profile Diagram Example: Sample Profile Diagram illustrating domain-specific stereotypes and extensions.
-
What is Profile Diagram in UML?: Reference for creating custom UML profiles and stereotypes.
-
What is Interaction Overview Diagram?: Reference for orchestrating complex interactions with activity-style notation.
-
Free UML Tool: Information about Visual Paradigm’s free community edition for personal and educational UML modeling.
-
Visual Paradigm Homepage: Official website for Visual Paradigm, provider of industry-standard UML modeling tools.
-
UML Tool Solution Page: Product overview for Visual Paradigm’s UML modeling capabilities.
-
Top 5 UML Tools Blog Post: Comparative analysis highlighting Visual Paradigm’s distinguishing features among UML tools.
-
Comprehensive UML Tools: Overview of Visual Paradigm’s full-featured UML modeling suite.
-
UML Modeling Process Guide: Guide integrating UML modeling practices with software development workflows.
-
UML Tool Features: Detailed feature list for Visual Paradigm’s UML modeling capabilities.
-
UML Tool Demo Video: Video demonstration of Visual Paradigm’s UML modeling interface and workflows.
-
Visual Paradigm Online UML Tool: Web-based UML modeling features available in Visual Paradigm Online.
-
Full-Featured UML Tool: Enterprise-grade UML modeling solution overview.
-
UML Modeling User Guide: Official user documentation for UML modeling in Visual Paradigm.
-
IDE Integration Overview: Documentation for integrating Visual Paradigm with popular development environments.
-
Code Engineering Tools: Features for round-trip engineering between UML models and source code.
-
AI-Assisted Class Diagram Generator: AI-powered feature for generating Class Diagrams from natural language descriptions.
-
Overview of 14 UML Diagram Types: Complete reference guide to all official UML 2.x diagram types.
-
PlantUML Integration Demo: Video demonstration of converting PlantUML scripts to visual diagrams.
-
Visual Modeling Tool Features: Overview of Visual Paradigm’s core visual modeling capabilities.
-
Free UML Design Tool: Information about free UML design capabilities for students and educators.
-
Free Use Case Tool: Free tooling options specifically for Use Case modeling.
-
Visual Paradigm Support FAQ: Frequently asked questions and support resources for Visual Paradigm users.
-
Free Online UML Tool: Browser-based free UML modeling option with zero installation requirements.