


Systems analysis involves more than just listing requirements; it requires a deep understanding of how internal components interact to fulfill those requirements. One of the most powerful tools for this task is the Composite Structure Diagram. While class diagrams show relationships between objects, composite structure diagrams dive deeper, revealing the internal architecture of a classifier.
For students of systems analysis, mastering the visual representation of internal structures is essential. This guide explores composite structure diagram examples and real-world scenarios to help you understand the practical application of this UML notation. We will break down the anatomy of these diagrams and apply them to complex systems without relying on specific commercial software.
What is a Composite Structure Diagram? 🤔
A Composite Structure Diagram (CSD) depicts the internal structure of a classifier. It shows the parts that make up the classifier, the interfaces that they provide, and the connections between them. Think of it as a blueprint for the inside of a component.
- Parts: The objects or components contained within the classifier.
- Ports: The points of interaction where parts connect to the outside world.
- Connectors: The links that establish communication between ports.
- Interfaces: Specifications of the services provided or required.
Unlike a class diagram, which focuses on static relationships like inheritance and aggregation, a CSD focuses on the internal wiring of a system. It answers the question: “How does this object work from the inside?”
Core Components Explained 🔧
To create accurate diagrams, you must understand the building blocks. Each element serves a specific purpose in defining the system’s behavior.
1. Parts 🧩
Parts are the internal components. They are depicted as rectangles inside the main classifier box. Each part has a role, such as a “PaymentProcessor” or “DatabaseConnection”. In systems analysis, defining parts helps identify responsibilities and boundaries.
2. Ports 🚪
Ports are interaction points. A part cannot connect directly to another part without a port. Ports define the interface through which a part communicates. They can be:
- Provided Interfaces: Services the part offers to others.
- Required Interfaces: Services the part needs from others.
3. Connectors 🔗
Connectors link ports together. They represent the flow of data or control signals. A connector ensures that the output of one port matches the input requirement of another. This is crucial for ensuring system coherence.
4. Interfaces 📋
Interfaces are abstract contracts. They define what operations are available without specifying how they are implemented. In a composite structure diagram, interfaces are often shown as circles (lollipop notation) or rectangles with a specific stereotype.
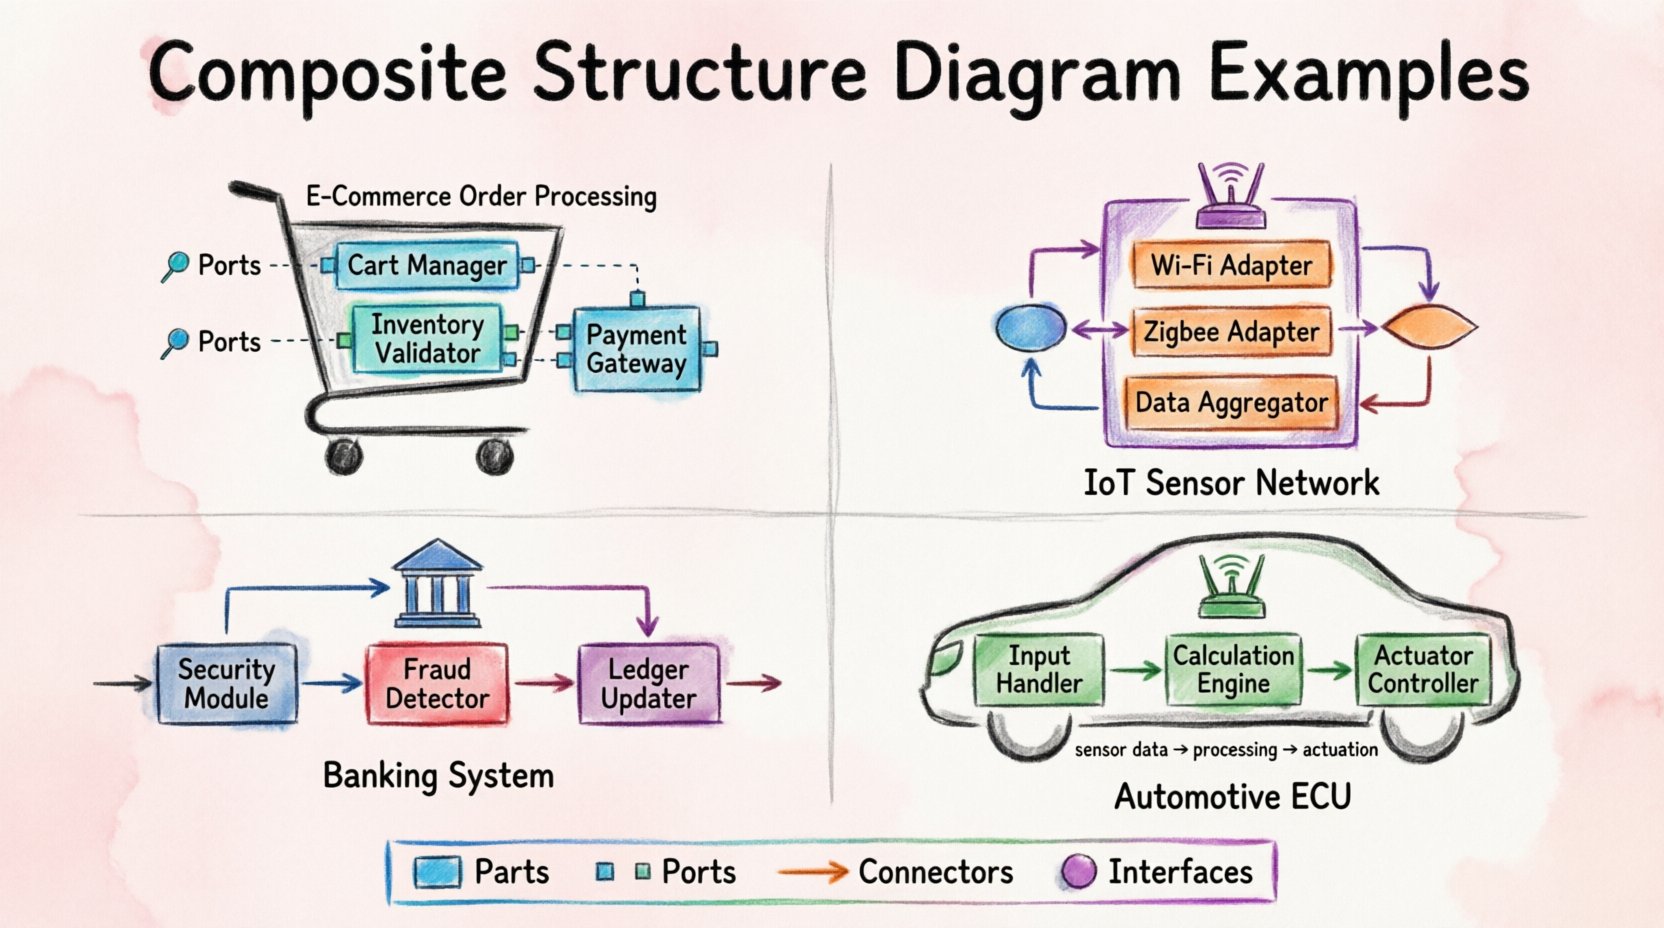
Real-World Scenario 1: E-Commerce Order Processing 🛒
In modern web development, order processing is a critical function. A Composite Structure Diagram for an E-Commerce System reveals how the “Order” object manages its internal dependencies.
System Context
When a customer clicks “Checkout”, the Order object activates. It does not handle payment directly. Instead, it delegates tasks to internal parts.
Internal Structure Breakdown
- Main Classifier: Order System
- Part 1: Cart Manager
- Role: Manages items and quantities.
- Interface: Provides “GetTotal” and “AddItem”.
- Part 2: Inventory Validator
- Role: Checks stock availability.
- Interface: Requires “CheckStock” from Warehouse.
- Part 3: Payment Gateway
- Role: Processes financial transactions.
- Interface: Requires “ProcessTransaction”.
Connections and Flow
The Order System connects to the Inventory Validator to ensure items exist. If stock is confirmed, the Order System connects to the Payment Gateway to collect funds. Only after both internal parts confirm success does the Order System move to the “Completed” state.
Why Use CSD Here?
A class diagram would show that Order has a relationship with Inventory. A composite structure diagram shows that the Order contains a validator logic. This distinction helps students understand delegation and internal state management.
Real-World Scenario 2: IoT Sensor Network 📡
The Internet of Things (IoT) relies heavily on embedded systems. A smart home hub coordinates various sensors and actuators. A Composite Structure Diagram for an IoT Hub clarifies how the hub manages diverse hardware connections.
System Context
The Hub must support multiple protocols (Wi-Fi, Zigbee, Bluetooth). It must aggregate data and send commands to devices.
Internal Structure Breakdown
- Main Classifier: SmartHub
- Part 1: Protocol Adapter (Wi-Fi)
- Port: Provides “InternetConnection”.
- Part 2: Protocol Adapter (Zigbee)
- Port: Provides “LocalMeshNetwork”.
- Part 3: Data Aggregator
- Port: Requires “SensorData” from both adapters.
Connections and Flow
The Data Aggregator connects to the Wi-Fi Adapter and the Zigbee Adapter. It pulls data from both required ports. This internal structure allows the Hub to normalize data formats before sending them to the cloud.
Why Use CSD Here?
In IoT, hardware compatibility is a major challenge. Showing the adapters as internal parts within the Hub helps analysts visualize how the system abstracts different hardware complexities behind a unified interface.
Real-World Scenario 3: Banking Transaction System 🏦
Security and integrity are paramount in banking. A Composite Structure Diagram for a Banking System highlights the separation of duties and security layers.
System Context
A transaction request must pass through authentication, validation, and ledger updates. These steps are often encapsulated within the main Transaction object.
Internal Structure Breakdown
- Main Classifier: Transaction
- Part 1: Security Module
- Role: Validates user credentials.
- Interface: Provides “AccessControl”.
- Part 2: Fraud Detector
- Role: Analyzes transaction patterns.
- Interface: Requires “TransactionHistory”.
- Part 3: Ledger Updater
- Role: Records the financial change.
- Interface: Requires “CommitTransaction”.
Connections and Flow
The flow is sequential. Security Module must pass before Fraud Detector. The Fraud Detector must pass before Ledger Updater. If the Fraud Detector blocks the request, the Ledger Updater is never triggered. This internal dependency chain is best visualized in a composite structure diagram.
Why Use CSD Here?
Class diagrams would show dependencies, but they would not show the strict internal ordering of execution. The CSD emphasizes the safety mechanisms embedded within the transaction object itself.
Real-World Scenario 4: Automotive Control System 🚗
Modern vehicles are computers on wheels. An Automotive Control System manages engine performance, safety features, and user interfaces.
System Context
The Engine Control Unit (ECU) processes sensor data to adjust fuel injection and ignition timing.
Internal Structure Breakdown
- Main Classifier: ECU
- Part 1: Input Handler
- Role: Reads sensors (RPM, Temp).
- Part 2: Calculation Engine
- Role: Runs control algorithms.
- Part 3: Actuator Controller
- Role: Sends signals to injectors.
Connections and Flow
Input Handler feeds data to the Calculation Engine. The Calculation Engine sends control signals to the Actuator Controller. This pipeline is continuous and requires real-time synchronization.
Why Use CSD Here?
Embedded systems often have strict timing constraints. Visualizing the data flow between internal parts helps analysts identify potential bottlenecks or synchronization issues in the hardware architecture.
Comparison of Diagram Types 📊
Students often confuse Composite Structure Diagrams with other UML diagrams. The following table clarifies when to use each.
| Diagram Type | Focus | Best Used For |
|---|---|---|
| Class Diagram | Static structure and relationships | Database design, general object modeling |
| Component Diagram | High-level system modules | Software architecture overview |
| Composite Structure Diagram | Internal structure of a classifier | Embedded systems, complex object internals |
Best Practices for Creating CSDs ✅
To ensure your diagrams are effective and maintainable, follow these guidelines.
- Keep it Readable: Avoid creating diagrams with too many internal parts. If it becomes cluttered, consider splitting the classifier.
- Define Clear Interfaces: Every port should have a well-defined interface. This reduces coupling and increases flexibility.
- Use Stereotypes: Utilize stereotypes to indicate the nature of parts (e.g., <<control>>, <<boundary>>).
- Focus on Interaction: The value of a CSD lies in the connections. Ensure connectors clearly show data flow direction.
- Document Constraints: If a part has specific timing or resource constraints, note them near the part or connector.
Common Mistakes to Avoid ❌
Even experienced analysts make errors when modeling internal structures. Watch out for these pitfalls.
- Mixing Levels of Abstraction: Do not mix high-level modules with low-level functions in the same diagram.
- Ignoring Required Interfaces: A part cannot function in isolation. Ensure all required services are explicitly shown.
- Overusing Nested Parts: Deep nesting makes the diagram hard to read. Keep the hierarchy shallow.
- Missing Ports: Parts should not connect directly to each other without ports. Always use ports as the connection point.
- Ignoring State: While CSDs focus on structure, the state of parts often influences behavior. Consider adding state information if critical.
Step-by-Step Construction Guide 📝
When analyzing a system, follow this process to create a Composite Structure Diagram.
- Identify the Classifier: Determine the main object or component you are analyzing (e.g., “Order”, “ECU”, “Hub”).
- List Internal Parts: Break the classifier down into its functional sub-components.
- Define Ports: For each part, determine what it needs and what it offers.
- Draw Connectors: Link the ports based on the logical flow of data or control.
- Review Interfaces: Ensure all connections are valid according to the interface specifications.
- Validate with Scenarios: Walk through a user scenario to ensure the internal structure supports the required behavior.
Advanced Considerations 🔍
As you gain experience, you will encounter more complex scenarios. Here are some advanced topics to keep in mind.
1. Value Types and Interfaces
Interfaces can be provided or required. A “Provided” interface is a service the part offers. A “Required” interface is a service the part consumes. Distinguishing these clearly is vital for dependency analysis.
2. Collaboration
Composite structure diagrams often represent a collaboration between parts. The diagram shows how the parts work together to achieve the classifier’s goal. This is distinct from a collaboration diagram, which focuses on object interactions over time.
3. Delegation
Delegation allows a part to pass a request to another part. For example, a “User Interface” part might delegate a “Login” request to a “Authentication Service” part. This simplifies the internal structure by hiding complexity.
Conclusion on System Analysis 🎯
The Composite Structure Diagram is a specialized tool for systems analysis. It provides the granularity needed to understand how complex objects are built from smaller parts. By focusing on internal structure, ports, and connectors, analysts can design more robust and maintainable systems.
Whether you are designing an e-commerce platform, an IoT device, or an embedded controller, understanding the internal wiring of your components is a skill that pays off. Use the examples and guidelines provided here to improve your modeling techniques.
Remember, the goal is clarity. A good diagram explains the system to anyone who reads it. Avoid unnecessary complexity, focus on the critical interactions, and ensure your interfaces are well-defined. With practice, you will be able to visualize internal structures with confidence and precision.