


Introduction
Imagine you’re planning to build a house. Before laying the first brick, you’d want blueprints, right? These blueprints help architects, builders, electricians, and plumbers all understand the plan from their perspective. Unified Modeling Language (UML) works the same way for software systems—it’s the universal blueprint language that helps everyone involved in a project visualize, design, and communicate how a system should work.

Whether you’re a business analyst, project manager, or someone curious about how software is designed, UML provides a visual way to understand complex systems without needing to read thousands of lines of code. This guide breaks down UML into digestible concepts, showing you the essential diagrams and when to use them—no technical background required.
What is UML?
Unified Modeling Language (UML) is a standardized visual modeling language used to design, document, and communicate software systems. Think of it as a universal picture language that helps teams:
-
Visualize system designs before building them
-
Communicate ideas clearly across different stakeholders
-
Document how systems work for future reference
-
Plan complex software architectures
UML is managed by the Object Management Group (OMG) and has become the industry standard for software modeling worldwide.

Why UML Matters (Even If You’re Not a Developer)
The Challenge UML Solves
Modern software systems are incredibly complex. They involve:
-
Multiple teams (developers, testers, designers, business analysts)
-
Various stakeholders (customers, managers, end-users)
-
Different technical components working together
-
Ongoing maintenance and updates
Without a common visual language, miscommunication leads to costly mistakes, delays, and frustrated teams.
Key Benefits
-
Clear Communication: Everyone sees the same picture
-
Early Problem Detection: Spot design flaws before coding begins
-
Better Documentation: Creates a reference guide for the system
-
Faster Onboarding: New team members understand the system quickly
-
Reduced Costs: Fixing design issues is cheaper than fixing code
As Grady Booch (one of UML’s creators) said: “For 80% of all software, only 20% of UML is needed.” You don’t need to master everything—just the essentials.
A Brief History of UML
UML wasn’t created overnight. It emerged in the mid-1990s when three software experts—Grady Booch, James Rumbaugh, and Ivar Jacobson (known as “The Three Amigos”)—combined their best ideas into one unified language.

Key Milestones:
-
1994-1996: The Three Amigos merged their methods at Rational Corporation
-
1997: Object Management Group (OMG) adopted UML as a standard
-
2005: UML 2.0 released with major improvements
-
Current: UML 2.5 is the latest version
The language has evolved to support everything from simple applications to enterprise-scale systems.
The 14 UML Diagram Types: Your Complete Toolkit
UML diagrams fall into two main categories:
Structure Diagrams (7 types)
Show the static parts of a system—what it’s made of.
Behavior Diagrams (7 types)
Show the dynamic aspects—how the system behaves over time.

STRUCTURE DIAGRAMS: Understanding System Components
1. Class Diagram
What it shows: The building blocks of your system (classes) and how they relate to each other.
When to use:
-
Designing the core structure of your system
-
Documenting database schemas
-
Planning object-oriented code
Key Concepts:
-
Classes: Categories of objects (e.g., “Customer,” “Order”)
-
Attributes: Properties of classes (e.g., customer name, order date)
-
Relationships: How classes connect (association, inheritance, aggregation)

Real-World Analogy: Think of a class diagram like an organizational chart showing departments and reporting relationships.
2. Component Diagram
What it shows: How larger software components fit together.
When to use:
-
Planning system architecture
-
Understanding dependencies between modules
-
Designing microservices
Key Concepts:
-
Components: Reusable software units (like LEGO blocks)
-
Interfaces: Connection points between components
-
Dependencies: Which components rely on others

Real-World Analogy: Like a car’s assembly diagram showing how the engine, transmission, and wheels connect.
3. Deployment Diagram
What it shows: Where software components physically run (servers, computers, devices).
When to use:
-
Planning IT infrastructure
-
Designing cloud deployments
-
Documenting hardware requirements
Key Concepts:
-
Nodes: Physical or virtual machines
-
Artifacts: Software files deployed on nodes
-
Connections: Network links between nodes

Real-World Analogy: A floor plan showing where furniture (software) goes in each room (server).
4. Object Diagram
What it shows: A snapshot of actual objects at a specific moment in time.
When to use:
-
Illustrating specific examples
-
Testing design concepts
-
Debugging complex relationships
Key Concepts:
-
Objects: Actual instances of classes
-
Links: Connections between specific objects
-
Values: Actual data at that moment
Class Diagram vs Object Diagram:


Real-World Analogy: A class diagram is like a blank form template; an object diagram is a filled-out form with actual data.
5. Package Diagram
What it shows: How related elements are grouped together.
When to use:
-
Organizing large projects
-
Managing dependencies between modules
-
Structuring enterprise applications
Key Concepts:
-
Packages: Folders containing related elements
-
Dependencies: Which packages need others

Real-World Analogy: Like organizing files into folders on your computer.
6. Composite Structure Diagram
What it shows: The internal structure of complex components.
When to use:
-
Designing complex systems
-
Understanding internal collaborations
-
Modeling component internals
Key Concepts:
-
Parts: Internal components
-
Ports: Interaction points
-
Connectors: Links between parts

Real-World Analogy: Looking inside a smartphone to see how the battery, processor, and screen connect.
7. Profile Diagram
What it shows: Custom extensions and stereotypes for specific domains.
When to use:
-
Creating industry-specific modeling standards
-
Extending UML for specialized needs
-
Defining custom modeling rules
Key Concepts:
-
Stereotypes: Custom labels for elements
-
Tagged values: Additional properties
-
Constraints: Rules for usage

Real-World Analogy: Creating custom icons for a specialized map (hospitals, schools, parks).
BEHAVIOR DIAGRAMS: Understanding System Actions
8. Use Case Diagram
What it shows: What users can do with the system.
When to use:
-
Gathering requirements
-
Communicating with stakeholders
-
Planning features
Key Concepts:
-
Actors: Users or external systems
-
Use Cases: Actions the system performs
-
Relationships: How actors and use cases connect

Real-World Analogy: A restaurant menu showing what customers can order.
Most Popular: Use case diagrams are among the most widely used UML diagrams (≥60% adoption).
9. Activity Diagram
What it shows: Step-by-step workflows and processes.
When to use:
-
Mapping business processes
-
Designing algorithms
-
Documenting workflows
Key Concepts:
-
Activities: Steps in the process
-
Decisions: Branching points (if/then)
-
Parallel paths: Simultaneous activities
-
Swimlanes: Who does what

Real-World Analogy: A flowchart showing the steps to process a customer order.
10. State Machine Diagram
What it shows: How objects change state over their lifecycle.
When to use:
-
Modeling object lifecycles
-
Designing state-dependent behavior
-
Understanding complex state transitions
Key Concepts:
-
States: Conditions an object can be in
-
Transitions: Changes between states
-
Events: Triggers that cause transitions

Real-World Analogy: A traffic light cycle (red → green → yellow → red).
11. Sequence Diagram
What it shows: How objects interact over time, in sequence.
When to use:
-
Designing detailed interactions
-
Understanding message flows
-
Documenting API calls
Key Concepts:
-
Lifelines: Objects participating
-
Messages: Communications between objects
-
Time: Flows from top to bottom
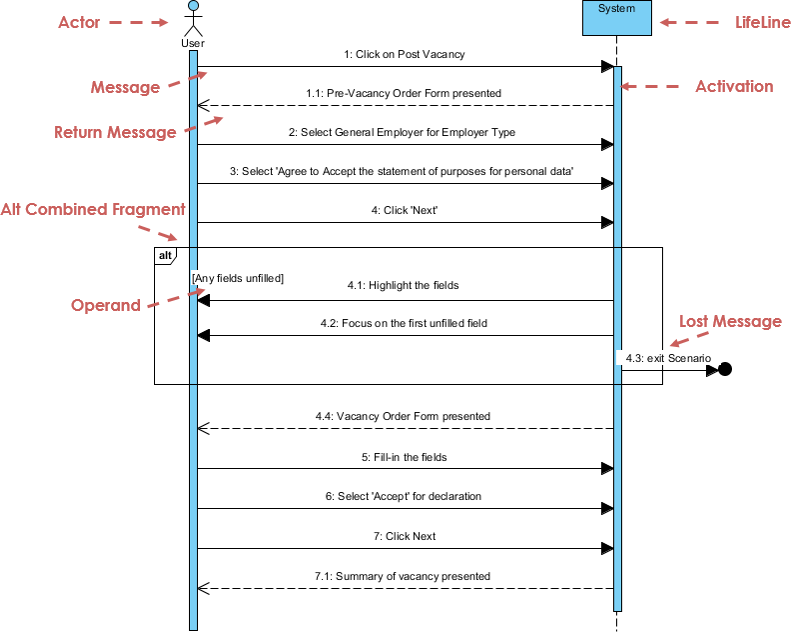
Real-World Analogy: A script showing who says what in a conversation, in order.
12. Communication Diagram
What it shows: Object interactions focusing on relationships rather than timing.
When to use:
-
Understanding object collaborations
-
Simplifying complex sequences
-
Showing structural relationships
Key Concepts:
-
Objects: Participants in the interaction
-
Messages: Communications (numbered for sequence)
-
Links: Connections enabling messages

Real-World Analogy: An org chart showing who communicates with whom.
13. Interaction Overview Diagram
What it shows: High-level flow of interactions.
When to use:
-
Providing overview of complex flows
-
Linking multiple diagrams
-
Showing control flow
Key Concepts:
-
Interaction frames: References to other diagrams
-
Flow control: Decision points and loops
-
Overview: Big picture view
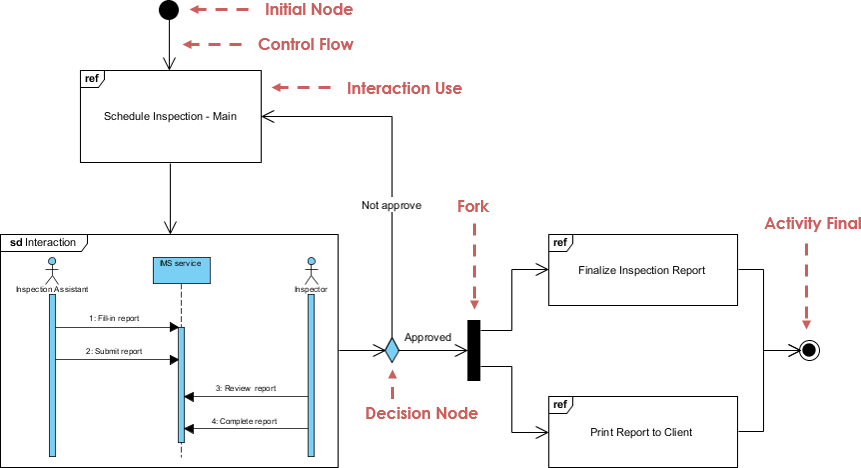
Real-World Analogy: A table of contents linking to detailed chapters.
14. Timing Diagram
What it shows: Behavior of objects over specific time periods.
When to use:
-
Real-time systems
-
Performance analysis
-
Time-critical interactions
Key Concepts:
-
Lifelines: Objects over time
-
States: Changes over time
-
Time scale: Horizontal axis

Real-World Analogy: A Gantt chart showing task durations and overlaps.
Which Diagrams Should You Learn First?
Based on industry surveys, here’s what professionals actually use:
Most Popular (≥60% usage)
-
Use Case Diagram – Requirements gathering
-
Class Diagram – System structure
-
Activity Diagram – Process flows
-
Sequence Diagram – Object interactions
Moderately Used (40-60% usage)
-
State Machine Diagram
-
Component Diagram
-
Deployment Diagram
Less Common (≤40% usage)
-
Object Diagram
-
Package Diagram
-
Communication Diagram
-
Timing Diagram
-
Interaction Overview Diagram
-
Composite Structure Diagram
-
Profile Diagram

Beginner’s Learning Path:
-
Start with Use Case Diagrams (easiest to understand)
-
Move to Activity Diagrams (familiar flowcharts)
-
Learn Class Diagrams (core structure)
-
Practice Sequence Diagrams (detailed interactions)
Key UML Concepts Simplified
Essential Terminology
-
Actor: A person or system that interacts with your system
-
Class: A category or template for objects (like “Customer”)
-
Object: An actual instance of a class (like “John Smith, Customer #123”)
-
Attribute: A property or characteristic (like “customer name”)
-
Operation: An action or behavior (like “place order”)
-
Relationship: How elements connect to each other
-
Multiplicity: How many instances (like “1 to many”)
Relationship Types
-
Association: A connection between two elements
-
Example: “Customer places Order”
-
-
Inheritance (Generalization): One class is a specialized version of another
-
Example: “Savings Account” inherits from “Account”
-
-
Aggregation: A “whole-part” relationship
-
Example: “Department has Employees”
-
-
Composition: A stronger “whole-part” where parts can’t exist alone
-
Example: “House has Rooms” (rooms don’t exist without the house)
-
Visibility Levels
-
Public (+): Anyone can access
-
Protected (#): Only the class and its subclasses
-
Private (-): Only the class itself
Getting Started with UML: Your Action Plan
Step 1: Choose Your Diagram Type
Ask yourself:
-
What do I want to show?
-
System features? → Use Case Diagram
-
Structure? → Class Diagram
-
Process flow? → Activity Diagram
-
Interactions? → Sequence Diagram
-
Step 2: Gather Information
-
Identify stakeholders
-
List key actors and use cases
-
Document main processes
-
Sketch rough ideas on paper
Step 3: Start Simple
-
Begin with basic elements
-
Add details gradually
-
Don’t try to model everything at once
-
Focus on the 20% that gives 80% value
Step 4: Use the Right Tools
Free Options:
-
Visual Paradigm Community Edition – Full-featured, free for learning
-
Lucidchart – Web-based, free tier available
-
Draw.io – Completely free, browser-based
Professional Options:
-
Visual Paradigm Professional – Advanced features, AI assistance
-
Enterprise Architect – Enterprise-grade modeling
-
IBM Rational Rose – Industry standard (legacy)
Modern UML: AI-Powered Modeling
The future of UML is here! Modern tools now offer AI-assisted diagram generation, making modeling faster and easier than ever.
AI Diagram Generation Features
AI Diagram Chatbot: Simply describe your system in plain English, and AI creates the diagram instantly.
Example: “Create a use case diagram for an online bookstore where customers can browse books, add to cart, and checkout”
Desktop AI Generator: Professional-grade modeling tools integrated directly into your workflow.
OpenDocs Knowledge Management: Automatically sync diagrams with documentation.
Benefits:
-
⚡ Speed: Create complex diagrams in seconds
-
🎯 Accuracy: AI ensures proper UML syntax
-
📚 Learning: See best practices in action
-
🔄 Evolution: Update diagrams as requirements change
Common Mistakes to Avoid
1. Over-Modeling
❌ Creating diagrams for everything
✅ Focus on what adds value
2. Too Much Detail Too Soon
❌ Including every attribute and method
✅ Start high-level, add details as needed
3. Ignoring the Audience
❌ Using technical diagrams for business stakeholders
✅ Match the diagram to the audience
4. Outdated Diagrams
❌ Creating diagrams once and forgetting them
✅ Keep diagrams updated with the system
5. Perfectionism
❌ Spending hours making diagrams perfect
✅ Good enough is good enough—communicate clearly
UML in Different Roles
Business Analysts
-
Primary diagrams: Use Case, Activity
-
Focus: Requirements, processes, workflows
-
Goal: Bridge business and technical teams
Project Managers
-
Primary diagrams: Use Case, Activity, Deployment
-
Focus: Scope, timelines, resources
-
Goal: Track progress and dependencies
System Architects
-
Primary diagrams: Class, Component, Deployment
-
Focus: System structure, architecture
-
Goal: Design scalable, maintainable systems
Developers
-
Primary diagrams: Class, Sequence, State Machine
-
Focus: Implementation details
-
Goal: Write correct, efficient code
Testers/QA
-
Primary diagrams: Activity, State Machine, Sequence
-
Focus: Test scenarios, edge cases
-
Goal: Ensure system works correctly
Real-World Applications
E-Commerce System
-
Use Case: Customer browsing, purchasing
-
Class: Product, Order, Customer, Payment
-
Activity: Order fulfillment process
-
Sequence: Checkout flow
Healthcare System
-
Use Case: Patient registration, appointment scheduling
-
State Machine: Patient status (admitted, discharged, etc.)
-
Deployment: Hospital servers, clinics, mobile apps
Banking System
-
Class: Account, Transaction, Customer
-
Activity: Loan approval process
-
Sequence: ATM withdrawal
-
Deployment: Branch offices, data centers, mobile banking
Best Practices for Success
1. Start with a Purpose
Always ask: “What question am I trying to answer?”
2. Keep It Simple
-
One diagram, one purpose
-
Avoid clutter
-
Use consistent naming
3. Use Standard Notation
-
Follow UML standards
-
Don’t invent your own symbols
-
Document any custom extensions
4. Iterate and Refine
-
Create rough drafts first
-
Get feedback early
-
Revise as needed
5. Link Diagrams Together
-
Show relationships between diagrams
-
Maintain consistency
-
Create a navigable model
6. Validate with Stakeholders
-
Review with business users
-
Confirm with developers
-
Update based on feedback
Learning Resources
Recommended Books
-
UML Distilled by Martin Fowler – Best for beginners
-
The Unified Modeling Language User Guide by Booch, Rumbaugh, Jacobson – Comprehensive reference
-
Learning UML 2.0 by Russ Miles – Practical approach
-
Applying UML and Patterns by Craig Larman – Object-oriented design focus
Online Resources
-
Object Management Group (OMG): Official UML specifications
-
Visual Paradigm Guides: Free tutorials and examples
-
UML Tutorials: Interactive learning platforms
Practice Projects
-
Model your favorite app’s features
-
Diagram a business process you know
-
Create a class diagram for a simple game
-
Map out a website’s user flows
UML Certification
Consider certification if you want to:
-
Validate your skills
-
Enhance your resume
-
Demonstrate expertise
Popular Certifications:
-
OMG Certified UML Professional (OCUP)
-
Visual Paradigm certifications
-
Industry-specific certifications
The Future of UML
UML continues to evolve with modern development practices:
Agile Integration
-
Lightweight modeling
-
Just-enough documentation
-
Iterative design
AI and Automation
-
Auto-generation from code
-
AI-assisted modeling
-
Intelligent validation
Cloud and DevOps
-
Infrastructure modeling
-
Microservices architecture
-
Continuous deployment diagrams
Low-Code/No-Code
-
Visual development platforms
-
Model-driven development
-
Citizen developers
Conclusion
UML doesn’t have to be intimidating. While the full specification spans over 700 pages with 14 different diagram types, you only need to master a handful to be effective.
Remember:
-
Start with the basics: Use Case, Activity, Class, and Sequence diagrams
-
Focus on communication, not perfection
-
Use the right diagram for the right audience
-
Leverage modern tools (especially AI-powered ones) to speed up your work
-
Practice regularly—modeling is a skill that improves with use
Whether you’re a business analyst gathering requirements, a project manager tracking scope, or a developer designing systems, UML gives you a powerful visual language to make complex ideas clear.
Your Next Steps:
-
Pick one diagram type to learn this week
-
Download a free UML tool (Visual Paradigm Community Edition is excellent)
-
Model something simple—a coffee shop ordering system, a library checkout process
-
Share your diagram and get feedback
-
Gradually expand your toolkit
The best way to learn UML is by doing. Start small, stay consistent, and soon you’ll be creating clear, effective models that bridge the gap between ideas and implementation.
References
- UML Distilled: A Brief Guide to the Standard Object Modeling Language: A concise introduction to UML fundamentals, perfect for beginners seeking practical guidance.
- UML 2 and the Unified Process: Practical Object-Oriented Analysis and Design: Comprehensive guide connecting UML with the Unified Process methodology.
- Learning UML 2.0: A pragmatic introduction to UML with real-world examples and applications.
- Building Web Applications with UML: Focused guide on applying UML to web application development.
- The Unified Modeling Language Reference Manual: Complete reference covering all UML specifications in detail.
- The Elements of UML 2.0 Style: Best practices and style guidelines for creating effective UML diagrams.
- UML for Java Programmers: Practical UML guide tailored specifically for Java developers.
- Schaum’s Outline of UML: Study guide with solved problems and exercises for mastering UML concepts.
- The Unified Modeling Language User Guide: Authoritative guide from the creators of UML covering theory and practice.
- UML 2 Certification Guide: Fundamental and Intermediate Exams: Preparation material for OMG UML certification exams.
- Fundamentals of Object-Oriented Design in UML: Comprehensive coverage of object-oriented design principles using UML.
- Applying Use Case Driven Object Modeling with UML: An Annotated E-Commerce Example: Practical guide using use cases to drive object-oriented design.
- Designing Flexible Object Oriented Systems With UML: Focus on creating adaptable, maintainable systems using UML patterns.
- Use Case Driven Object Modeling with UML: Methodology for using use cases as the foundation for system design.
- Systems Analysis and Design with UML Version 2.0: An Object-Oriented Approach: Comprehensive textbook covering systems analysis and design using UML.
- UML 2.0 in a Nutshell: Quick reference guide for UML notation and concepts.
- Object-Oriented Analysis and Design with Applications: Classic text on object-oriented methodology by Grady Booch.
- UML Explained: Accessible introduction to UML for beginners and non-technical readers.
- Design Patterns: Elements of Reusable Object-Oriented Software: The seminal “Gang of Four” book on software design patterns.
- The Object Primer: Agile Model-Driven Development with UML 2.0: Guide to agile modeling practices using UML.
- Professional UML design tool for visual modeling: Visual Paradigm’s professional UML modeling software with comprehensive diagram support.
- Object Management Group (OMG): Official UML specification and standards organization.
- AI Diagram Generation Ecosystem: Modern AI-powered tools for automated UML diagram creation.
- Visual Paradigm AI Diagram Chatbot: Natural language interface for generating UML diagrams instantly.
- Visual Paradigm AI WebApps: Step-by-step AI-guided workflows for creating complex diagrams.
- Diagram Generator Guide: High-speed automated diagramming tools for professional modeling.
- OpenDocs Knowledge Management: Integrated environment for managing AI-generated diagrams and documentation.
- Free UML Tool Download: Visual Paradigm Community Edition – free UML software for learning and practice.