


Walk into any strategy meeting and you will likely see a whiteboard covered in four columns. Strengths, Weaknesses, Opportunities, Threats. It is a familiar sight. However, there is a significant gap between a wall of text and a roadmap for growth. Many organizations treat the SWOT analysis as a checkbox exercise, a once-a-year ritual that gathers dust before the next quarter begins. This approach misses the fundamental purpose of the framework. A list of factors is merely data. The goal is insight. The goal is action.
If you find yourself staring at a document full of generic statements like “strong brand” or “high competition,” you are not doing strategic planning. You are collecting noise. This guide explores how to transform a static inventory into a dynamic engine for decision-making. We will move beyond the basics to discuss rigorous data collection, cross-analysis techniques, and the discipline required to keep your strategy alive.
Understanding the Quadrants: More Than Just Labels 🧠
Before diving into the mechanics of action, we must ensure the foundation is solid. A SWOT analysis categorizes information into two dimensions: Internal and External. Within those dimensions, it splits into Positive and Negative factors.
- Strengths (Internal + Positive): These are assets you control. They might be proprietary technology, a loyal customer base, or a lean operational model.
- Weaknesses (Internal + Negative): These are limitations within your control. Gaps in talent, outdated infrastructure, or inefficient processes fall here.
- Opportunities (External + Positive): These are favorable conditions outside your organization. Market shifts, regulatory changes, or competitor missteps create openings.
- Threats (External + Negative): These are external risks. New regulations, economic downturns, or aggressive new entrants pose risks.
The error most teams make is treating these quadrants in isolation. They list strengths without asking how to leverage them against threats. They list weaknesses without seeing how opportunities can mitigate them. The power of the tool lies in the intersection, not the list itself.
The Data Trap: Why Lists Fail Strategically 📉
A list implies equality. It suggests that “having a large team” is just as important as “having a large team that is unproductive.” Without hierarchy and context, a SWOT document becomes a graveyard of good ideas. To avoid this, we must apply rigor to the data entry phase.
Consider the difference between an observation and a finding:
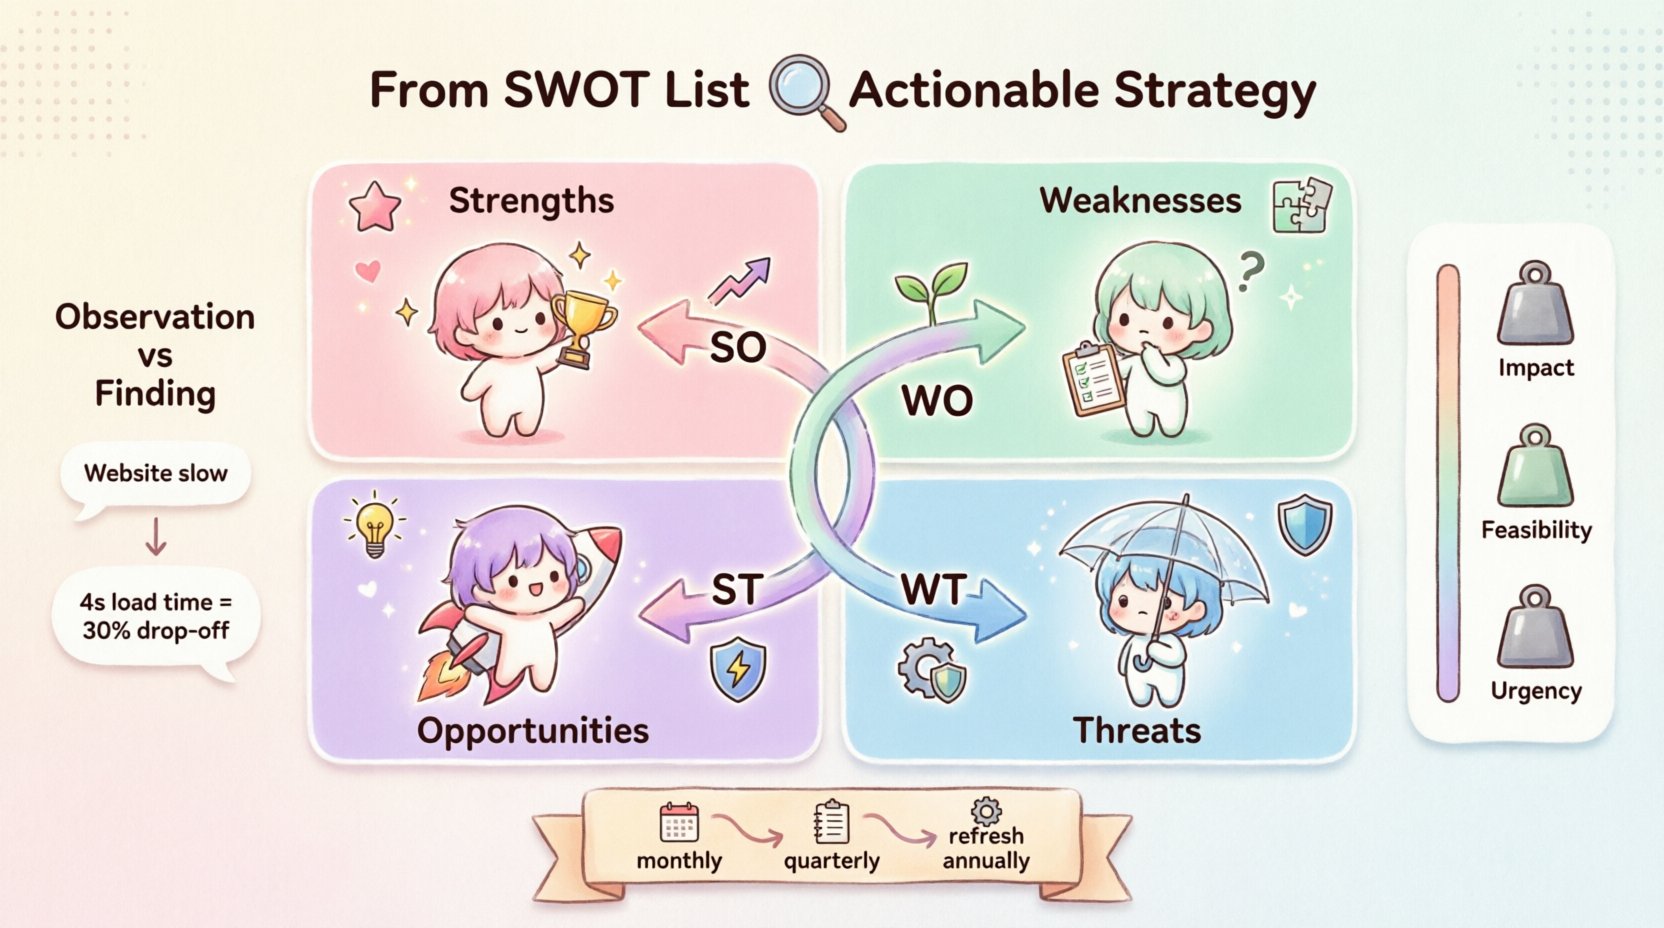
- Observation: “Our website loads slowly.”
- Why this fails: It is a symptom, not a root cause. It is a weak point, but it lacks context.
- Findings: “Our website load time exceeds 4 seconds, causing a 30% drop-off in mobile conversions during peak traffic.”
- Why this works: It quantifies the problem and links it to a business outcome (revenue loss).
When you fill your SWOT with observations, you invite debate. When you fill it with findings supported by evidence, you invite solutions.
Best Practices for Data Collection 📊
Gathering the right information requires a structured approach. Relying on a single brainstorming session often leads to groupthink or vocal dominance. Instead, use a multi-step process to ensure coverage.
1. Quantitative Evidence First
Start with numbers. Financial reports, customer satisfaction scores, churn rates, and production metrics provide an objective baseline. Avoid subjective adjectives like “good” or “bad” until the data is reviewed.
2. External Market Scanning
Opportunities and Threats are not visible from inside the building. You need to look outward. Monitor industry reports, competitor press releases, and regulatory filings. Join industry forums to hear what customers are actually complaining about regarding your competitors.
3. Internal Audits
Strengths and Weaknesses require honesty. Conduct interviews with frontline staff. They often know where the bottlenecks are before leadership does. Ask about friction points in their daily workflow.
The TOWS Matrix: Connecting the Dots 🔗
Once you have your lists, the next step is the most critical: Cross-Analysis. This is often called the TOWS Matrix. It forces you to combine factors from different quadrants to generate specific strategies. This is where the magic happens.
Here is how to connect the factors:
- SO Strategies (Maxi-Maxi): Use Strengths to maximize Opportunities.
- Example: We have a proprietary algorithm (Strength) and the market is demanding automation (Opportunity). Strategy: Launch the automated service immediately.
- WO Strategies (Mini-Maxi): Overcome Weaknesses by taking advantage of Opportunities.
- Example: Our sales team is small (Weakness) but the market is expanding (Opportunity). Strategy: Invest in a marketing automation platform to support the small team.
- ST Strategies (Maxi-Mini): Use Strengths to minimize Threats.
- Example: We have strong cash reserves (Strength) and a competitor is price-cutting (Threat). Strategy: Engage in a price war temporarily to capture market share, leveraging our liquidity.
- WT Strategies (Mini-Mini): Minimize Weaknesses and avoid Threats.
- Example: We have high debt (Weakness) and interest rates are rising (Threat). Strategy: Refinance debt immediately to lock in lower rates.
Without this matrix, you have four separate lists. With it, you have four distinct strategic pillars.
Prioritization: The Reality of Resources ⚖️
Even with a TOWS Matrix, you will have more ideas than resources. You cannot execute everything. Prioritization is not just about picking the “best” ideas; it is about picking the most feasible ones. Use a framework to score your initiatives.
Consider scoring each strategy on the following criteria:
- Impact: How much will this move the needle on revenue or efficiency?
- Feasibility: Do we have the skills and time to execute this?
- Urgency: Is this time-sensitive due to market conditions?
Create a simple scoring table to visualize the trade-offs. Do not rely on gut feeling. A strategy that scores high on impact but low on feasibility will only lead to frustration. A strategy that scores high on feasibility but low on impact is a waste of effort.
Common Pitfalls to Avoid 🚫
Even with a good framework, human bias can derail the process. Be vigilant against these common errors.
| Pitfall | Description | The Fix |
|---|---|---|
| Confusing Causes and Effects | Listing “low sales” as a weakness instead of “poor lead generation”. | Ask “Why” five times to find the root cause. |
| Internal Focus Bias | Focusing heavily on strengths while ignoring external threats. | Assign a dedicated role to challenge internal assumptions. |
| Static Documents | Creating the analysis once and filing it away. | Schedule quarterly reviews to update factors. |
| Generic Statements | Using phrases like “excellent customer service” without metrics. | Require data or specific examples for every entry. |
Implementation: From Strategy to Execution 🛠️
A strategy document is useless if it does not change behavior. Once you have your prioritized list from the TOWS Matrix, you must translate it into operational tasks.
1. Assign Ownership
Every strategic initiative needs a single owner. This person is accountable for the outcome, not just the activity. When accountability is diffuse, nothing gets done.
2. Define Success Metrics
How do you know if the strategy is working? Set Key Performance Indicators (KPIs) for each initiative. If you are trying to reduce churn (a Weakness), your KPI might be “reduce churn rate by 2% in Q3.” If there is no metric, there is no management.
3. Integrate with Budgeting
Strategy and budget are often separate conversations. Align them. If your strategy relies on hiring, ensure the budget reflects that. If it relies on new software, ensure the CAPEX is approved. Money follows strategy.
Review Cadence: Keeping it Alive 🔄
The business environment is fluid. What was a Threat last year might be a non-factor today. What was a Strength might be obsolete. You need a rhythm for review.
- Monthly: Check on the progress of specific initiatives. Are the KPIs moving?
- Quarterly: Re-evaluate the SWOT factors. Have new competitors entered? Has technology shifted? Update the lists.
- Annually: Conduct a full strategic refresh. Revisit the mission and vision in the context of the updated SWOT.
Do not wait for a crisis to update your analysis. Proactive updates allow you to pivot before you are forced to react.
Real-World Scenario: A Retail Company 🏪
To illustrate the transformation from list to action, let us look at a hypothetical mid-sized retailer.
The Old Approach (The List)
- Strength: Good location.
- Weakness: Slow checkout.
- Opportunity: Online shopping growth.
- Threat: Big box stores.
Result: No clear direction. Do they open more stores? Do they build an app? Do they lower prices?
The New Approach (Actionable Insights)
- SO Strategy: Use the good location (Strength) to drive foot traffic for in-store pickup of online orders (Opportunity). Action: Install lockers in-store.
- WO Strategy: Address slow checkout (Weakness) by implementing mobile POS systems to speed up service during peak times (Opportunity: customer demand for speed). Action: Purchase and train on handheld devices.
- ST Strategy: Use strong local relationships (Strength) to create loyalty programs that Big Box stores cannot replicate (Threat). Action: Launch exclusive member rewards.
- WT Strategy: Reduce physical inventory costs (Weakness) to mitigate the risk of price wars (Threat). Action: Shift to a just-in-time inventory model.
Result: Four clear, funded, actionable projects derived directly from the analysis.
The Role of Facilitation 🗣️
The quality of the output depends heavily on the facilitator. A good facilitator does not just take notes; they challenge assumptions. They ensure that the quietest voices are heard, not just the loudest executives. They prevent the group from settling on the first idea that comes to mind.
Key facilitation techniques include:
- Brainwriting: Have participants write down ideas silently before sharing. This prevents anchoring bias.
- Dot Voting: Give participants limited votes to allocate to the most important factors. This reveals consensus quickly.
- Devil’s Advocate: Assign one person to argue against the group’s prevailing opinion to test the strength of the data.
Data Security and Confidentiality 🔒
SWOT analysis often involves sensitive information. Internal weaknesses and strategic opportunities can be dangerous if leaked. Ensure that the document is stored securely. Limit access to key stakeholders. When presenting externally, sanitize the data to remove proprietary details while still conveying the strategic context.
Measuring the ROI of the Process 📈
How do you know if the SWOT process was worth the time? Measure the outcome, not the output. Did the strategy lead to better decisions? Did it prevent a costly mistake? Did it identify a revenue stream that was previously missed?
If the team reports that the analysis helped them align on a single direction, the process was successful. If the team says, “We already knew that,” the process failed to add value. In that case, revisit the depth of the data and the rigor of the cross-analysis.
Final Thoughts on Strategic Discipline 🧭
A SWOT analysis is a tool, not a solution. It requires discipline to use correctly. It requires honesty to gather accurate data. It requires courage to admit weaknesses. But when executed with rigor, it provides a clear map through uncertainty. It shifts the conversation from “what do we want to do?” to “what can we actually achieve based on our reality?”
Stop treating it as a list. Start treating it as a conversation. Build the bridges between your data and your actions. That is where value is created.