


Launching a new venture involves navigating uncertainty, complex market dynamics, and intricate operational challenges. Many founders focus heavily on the product itself, overlooking the structural integrity of the business model. This oversight often leads to premature scaling or unexpected stagnation. A systematic approach to diagnosis is essential for identifying vulnerabilities before they become critical threats.
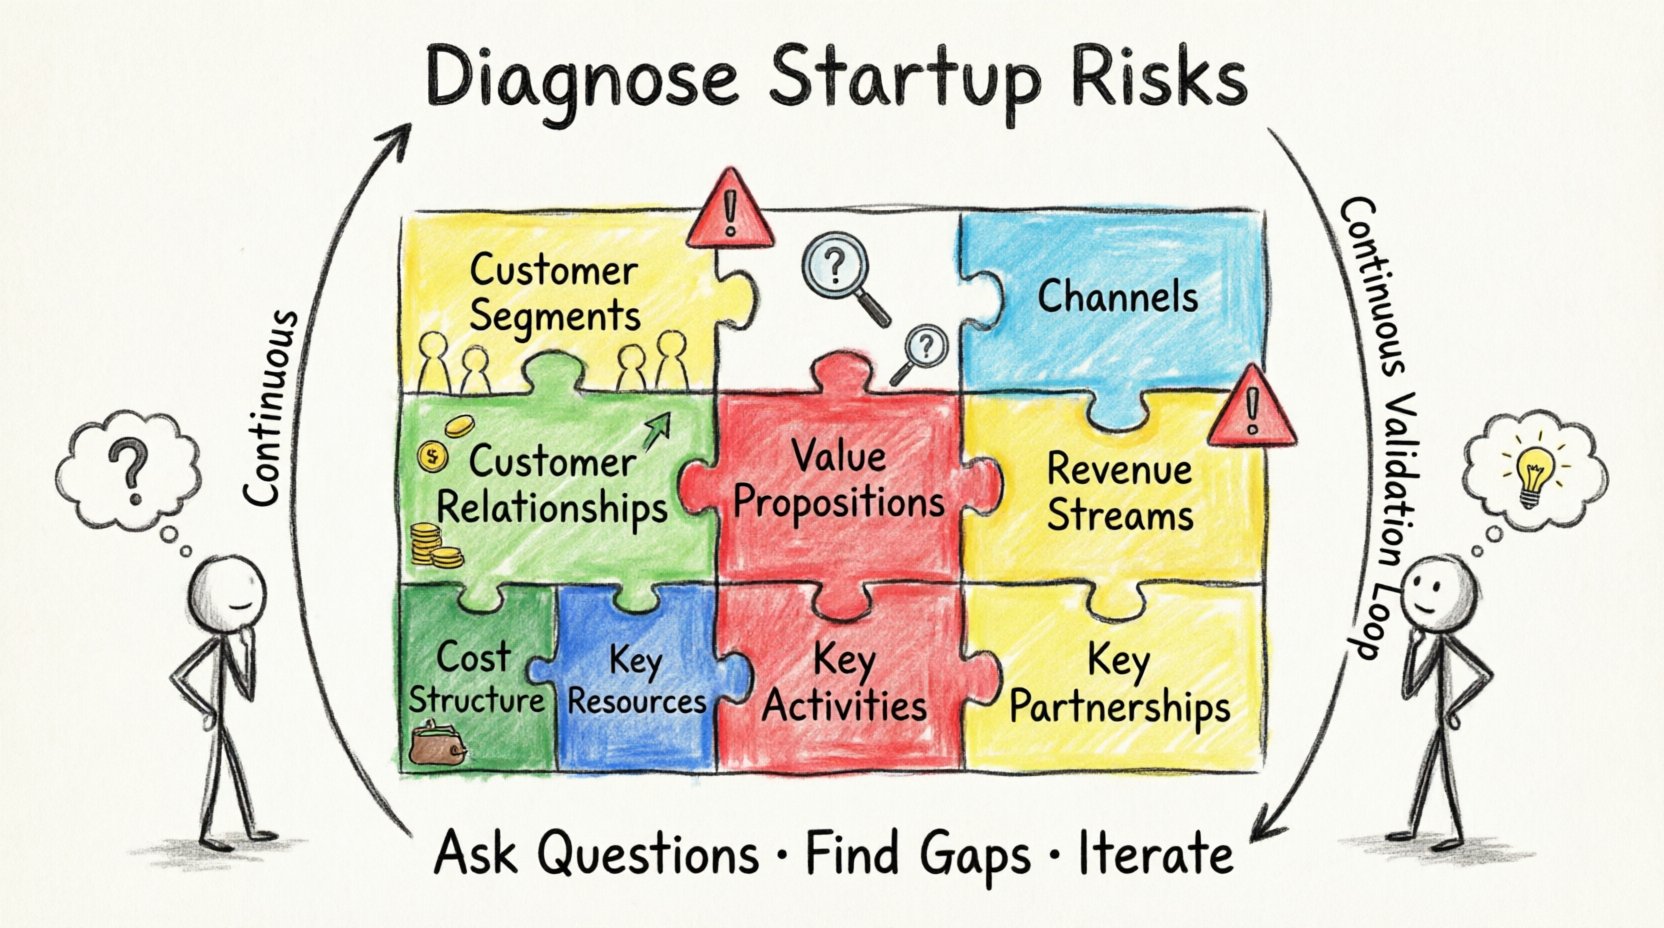
The Business Model Canvas (BMC) serves as a strategic management tool that maps out the nine building blocks of a business. While often used for initial planning, it is equally powerful for retrospective analysis and ongoing health checks. By dissecting each block, founders can pinpoint specific areas where value creation breaks down or where costs outpace revenue generation.
This guide explores how to leverage the Canvas framework to diagnose hidden failure points. We will examine each component, highlight common pitfalls, and provide actionable diagnostic questions. The goal is to build a resilient foundation that supports sustainable growth without relying on guesswork.
🧩 Understanding the Nine Building Blocks
To diagnose effectively, one must understand the interplay between the components. The Canvas is not a collection of isolated parts; a shift in one area inevitably impacts others. For instance, changing a value proposition may require new key activities or alter the customer relationship model.
- Customer Segments: Who are you creating value for?
- Value Propositions: What problem are you solving?
- Channels: How do you reach your customers?
- Customer Relationships: How do you interact and retain them?
- Revenue Streams: How does the business earn money?
- Key Resources: What assets are required?
- Key Activities: What actions must be taken?
- Key Partnerships: Who helps you deliver value?
- Cost Structure: What are the major costs involved?
Failure often occurs when these blocks are misaligned. For example, a company might have a strong Value Proposition but lack the Channels to deliver it effectively. Identifying these misalignments is the core of the diagnostic process.
💡 Diagnosing Value Proposition Risks
The Value Proposition is the heart of the model. It defines why customers choose your product over competitors. However, it is also the most subjective element, making it prone to founder bias. A common failure point is assuming the solution is valuable without validating the problem.
🛑 Symptoms of Value Proposition Failure
- High traffic to landing pages but low conversion rates.
- Customers express interest but hesitate to commit financially.
- Feature requests do not align with the core promise.
- Churn rates increase shortly after onboarding.
🔍 Diagnostic Questions
When reviewing this block, ask specific questions to uncover hidden weaknesses:
- Is the problem being solved painful enough for customers to seek a solution?
- Does the proposed solution offer a better alternative than existing workarounds?
- Is the value proposition clear enough to be explained in one sentence?
- Are there competitors offering similar value at a lower price or higher quality?
Validation requires direct engagement with the market. Surveys can provide data, but interviews reveal motivations. If customers cannot articulate why they need the product, the Value Proposition likely needs refinement.
🎯 Customer Segment Disconnects
Startups frequently fail because they target too broad a market or the wrong segment. The assumption that “everyone needs this” is a classic error. Precision in defining Customer Segments is critical for efficient resource allocation.
🛑 Symptoms of Segment Misalignment
- Customer acquisition costs rise disproportionately to lifetime value.
- Support tickets indicate users are confused about the use case.
- Growth stagnates after penetrating the initial niche.
- Feedback indicates the product fits a different use case than intended.
🔍 Diagnostic Questions
Analyze the segments currently engaging with the product:
- Who are the most satisfied users and why?
- Which segment has the highest retention rate?
- Are early adopters actually paying customers or just free users?
- Does the segment have the budget to sustain the pricing model?
Refining the segment definition often requires pivoting the messaging or even the product features. Focusing on a specific niche allows for deeper understanding and stronger positioning before expanding.
📡 Channel & Relationship Friction
Even the best product fails if it cannot reach the customer or if the relationship is not nurtured. Channels are the touchpoints through which customers experience the product. Relationships define how the company interacts with the segment.
🛑 Symptoms of Channel & Relationship Failure
- Long sales cycles with no clear path to close.
- High dependency on a single channel that fluctuates in cost.
- Customers feel unsupported after purchase.
- Low engagement with post-sale communications.
🔍 Diagnostic Questions
Review the efficiency of your delivery and retention mechanisms:
- Which channels bring the highest quality leads?
- Is the customer journey seamless across all touchpoints?
- Are customer support responses timely and helpful?
- Does the relationship model (self-service vs. personal) match customer expectations?
Friction in channels often leads to abandonment. For example, if the checkout process is complicated, revenue is lost. Similarly, if the relationship is too transactional, loyalty suffers. A mix of automated and human touchpoints often works best to balance scale and personalization.
💰 Financial Viability Checks
Revenue and Cost are the reality checks of any business model. Startups often underestimate costs or overestimate revenue potential. This block reveals the mathematical sustainability of the venture.
🛑 Symptoms of Financial Failure
- Burn rate exceeds the runway provided by funding.
- Revenue growth is driven solely by heavy discounting.
- Key activities cost more than the revenue they generate.
- Dependency on a single large client threatens stability.
🔍 Diagnostic Questions
Scrutinize the financial assumptions underlying the model:
- What is the true cost of acquiring a customer?
- Are there hidden costs in the Key Resources or Activities?
- Is the pricing model aligned with the perceived value?
- What happens if revenue drops by 20% for six months?
Cost structures must be scrutinized for scalability. Fixed costs that do not scale down during low demand can cripple a company. Revenue streams should be diversified to reduce risk. Subscription models offer stability, while transactional models offer higher potential upside but more volatility.
🏗️ Operational Dependencies
Key Resources, Key Activities, and Key Partnerships form the operational backbone. Without these, the Value Proposition cannot be delivered. Failure in this area often stems from over-reliance on external factors or internal bottlenecks.
🛑 Symptoms of Operational Failure
- Delays in product delivery due to resource constraints.
- Single points of failure in the supply chain.
- Key partners changing terms unexpectedly.
- Technology debt slowing down development.
🔍 Diagnostic Questions
Assess the robustness of your operations:
- Which resources are critical and irreplaceable?
- Are key activities automated or manual?
- Do partners have the capacity to scale with you?
- Is there a contingency plan if a key partner fails?
Building a resilient operation requires diversification. Relying on one vendor for a critical component is risky. Internal capabilities should be developed to reduce dependency where possible. Automation can reduce long-term costs, though it requires upfront investment.
📊 The Diagnostic Matrix
The following table summarizes the key failure indicators across the Canvas blocks. Use this as a checklist during regular review sessions.
| Block | Key Risk Indicator | Diagnostic Action |
|---|---|---|
| Value Proposition | Low conversion despite high interest | Conduct customer interviews to validate pain points. |
| Customer Segments | High churn in specific demographics | Analyze retention data by segment and refine targeting. |
| Channels | High acquisition cost per channel | Test alternative channels and optimize conversion funnels. |
| Customer Relationships | Low engagement post-purchase | Implement automated onboarding and support workflows. |
| Revenue Streams | Revenue growth plateaus | Review pricing strategy and explore upsell opportunities. |
| Key Resources | Resource bottlenecks limit growth | Invest in infrastructure or outsource non-core tasks. |
| Key Activities | Operational inefficiencies | Audit processes for automation and streamlining. |
| Key Partnerships | Partner dependency risk | Diversify supplier base and negotiate SLAs. |
| Cost Structure | Burn rate exceeds budget | Conduct a zero-based budget review to eliminate waste. |
🔄 Continuous Validation Loop
Diagnosis is not a one-time event. Markets change, customer needs evolve, and competitive landscapes shift. The Canvas must be treated as a living document that requires regular updates. A static model becomes obsolete quickly.
🔍 Establishing a Review Cadence
Schedule regular sessions to revisit the Canvas. Monthly reviews are common for early-stage startups, while quarterly reviews may suffice for more mature organizations. During these sessions:
- Compare actual performance data against model assumptions.
- Update the Value Proposition based on new market feedback.
- Adjust Cost Structures to reflect current operational realities.
- Identify new opportunities or emerging threats.
🔍 Iterating Based on Data
Data drives the iteration process. Do not rely on intuition alone. Use metrics to inform decisions. If a specific Key Activity is costing more than expected, investigate why. If a Revenue Stream is underperforming, test a new pricing tier.
Failure is often a result of sticking to a plan that no longer works. Flexibility is a strength. The ability to pivot based on diagnostic findings separates successful ventures from those that fade away.
🛠️ Practical Implementation Steps
Implementing this diagnostic framework requires discipline. Follow these steps to ensure thorough analysis:
- Gather Data: Collect metrics from all relevant departments.
- Map Current State: Fill out the Canvas with actual current data, not ideal scenarios.
- Identify Gaps: Highlight areas where assumptions do not match reality.
- Prioritize Fixes: Focus on the blocks that pose the greatest risk to survival.
- Test Changes: Implement small changes and measure the impact.
- Document Learnings: Record what worked and what did not for future reference.
This process creates a culture of continuous improvement. It moves the team from reactive firefighting to proactive strategy management.
🎯 Summary of Diagnostic Principles
Using the Canvas framework for diagnosis provides a structured way to understand business health. It moves the conversation from vague feelings of uncertainty to concrete data points. By focusing on the nine blocks, founders can identify hidden risks that might otherwise go unnoticed.
The most critical step is honesty. Admitting where the model is flawed is the first step toward fixing it. Avoiding the temptation to present a perfect picture ensures that resources are directed toward actual problems.
Remember that no business model is perfect at launch. The goal is to find the right fit and refine it over time. Regular diagnostics ensure that the fit remains strong as the business grows and the market evolves.
Start by picking one block to focus on this week. Dive deep into the data associated with it. Ask the diagnostic questions. Make a decision based on the findings. Repeat this process for the remaining blocks. This systematic approach builds a robust foundation for long-term success.