


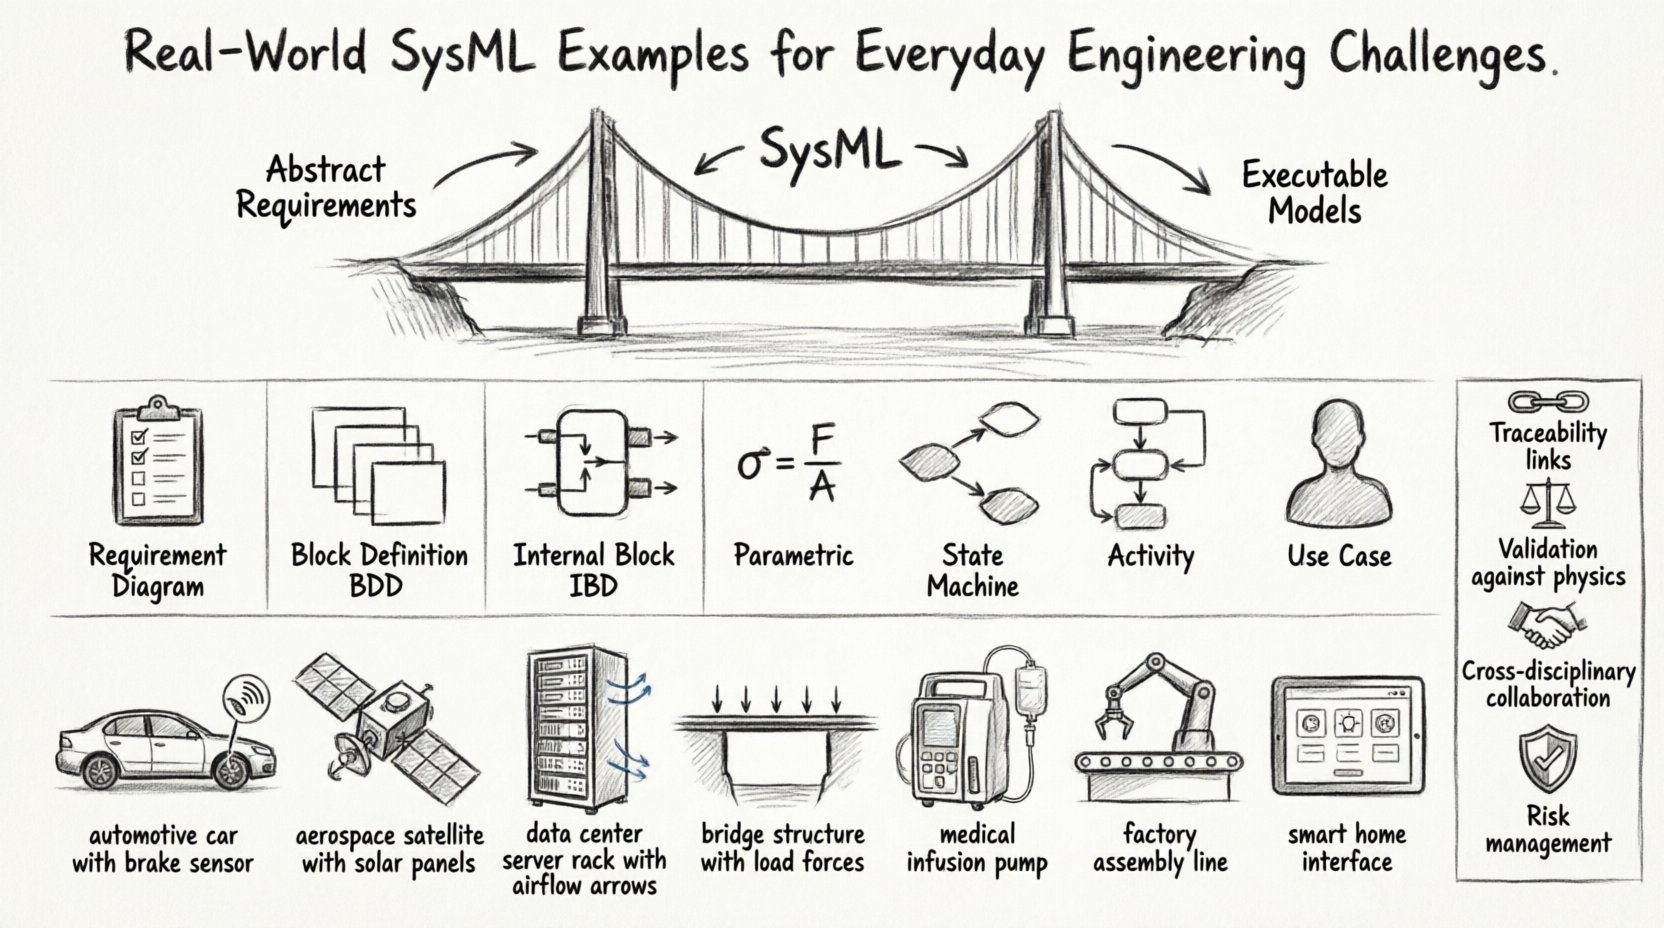
Systems engineering is not merely about drawing boxes and arrows. It is about defining the logic, constraints, and interactions that govern complex hardware and software ecosystems. Systems Modeling Language (SysML) provides a standardized notation to capture this complexity without ambiguity. When applied correctly, SysML transforms abstract requirements into executable architectural models. This guide explores practical examples where SysML addresses specific engineering hurdles.
Engineers often face the challenge of traceability. How do you ensure a specific line of code satisfies a thermal constraint defined years ago? SysML bridges this gap through explicit traceability links. Below, we examine how different diagram types solve real-world problems.
Understanding SysML in Practice 📐
Model-Based Systems Engineering (MBSE) relies on a living model rather than static documents. SysML extends the Unified Modeling Language (UML) to support non-software systems. It covers structure, behavior, requirements, and parametrics. The following sections detail how these facets interact in actual projects.
- Structure: Defines the parts and connections (BDD, IBD).
- Behavior: Describes how the system acts over time (State Machine, Activity, Sequence).
- Requirements: Captures what the system must do (Requirement Diagram).
- Parametrics: Analyzes performance constraints (Parametric Diagram).
Requirement Diagrams: From Text to Traceability ✅
One of the most common failures in engineering is the loss of requirement context. A text document often sits isolated from the design. SysML Requirement diagrams solve this by allowing hierarchical relationships and traceability links.
Example: Safety Compliance in Automotive Systems 🚗
Consider an autonomous vehicle project. The safety requirement states, “The braking system must activate if an obstacle is detected within 5 meters.” Without a model, this might be implemented in software without hardware verification. With SysML:
- Create a top-level requirement node for Safety.
- Derive a sub-requirement for the Sensor Module.
- Link the requirement to a Block in the Block Definition Diagram.
- Trace the link to a specific test case in the verification suite.
This creates a verifiable chain. If the requirement changes, the impact analysis shows which blocks and tests are affected immediately. Engineers can see the “why” behind every line of code or schematic.
Key Benefits of Requirement Modeling
- Traceability: Direct links from requirement to design element.
- Coverage: Automated checks ensure no requirement is orphaned.
- Versioning: Track changes to requirements alongside model updates.
Block Definition Diagrams (BDD) for Architecture 🧱
The Block Definition Diagram is the backbone of structural modeling. It defines the types of things that make up the system. Unlike simple flowcharts, BDDs allow for properties, operations, and interfaces.
Example: Power Distribution in Aerospace 🚀
Spacecraft systems require rigorous power management. A BDD helps define the hierarchy of power units.
- Parent Block: Power Management System.
- Child Blocks: Battery Unit, Solar Array, DC-DC Converter.
- Properties: Voltage rating, Current capacity, Mass.
- Interfaces: High-voltage input, Low-voltage output.
By defining these blocks with typed properties, the model becomes a data repository. Engineers can reference the Mass property in cost analysis or the Voltage rating in electrical schematics. This reduces the need for external spreadsheets.
Internal Block Diagrams (IBD) for Connections 🔗
While BDDs define types, Internal Block Diagrams define instances and connections. They show how parts interact physically or logically.
Example: Thermal Management in Data Centers 🌡️
Heat dissipation is a critical constraint in server farms. An IBD visualizes the flow of air and heat.
- Parts: Server Rack, Cooling Fan, Heat Sink, Air Duct.
- Ports: Air Intake, Air Exhaust, Thermal Interface.
- Flows: Airflow path, Heat transfer path.
Using IBDs, engineers can simulate airflow bottlenecks before physical construction. If a duct is blocked in the model, it is blocked in reality. This prevents costly retrofits later in the lifecycle.
Parametric Diagrams for Performance Analysis 📊
Parametric diagrams allow engineers to embed mathematical constraints directly into the model. This is crucial for physical systems where geometry and physics dictate design.
Example: Structural Load in Civil Engineering 🏗️
Consider a bridge support system. The load capacity depends on material strength and geometry.
- Variables: Force (F), Area (A), Stress (σ).
- Constraint: σ = F / A.
- Boundary: σ < Material_Yield_Strength.
When the modeler inputs a target Force, the constraint solver calculates the required Area. If the area is too large for the design envelope, the model flags a violation. This iterative loop ensures the design remains within physical limits.
Benefits of Parametric Modeling
- Validation: Checks design against physics equations.
- Optimization: Identifies minimum mass or cost to meet constraints.
- Trade-offs: Visualizes the impact of changing one variable on another.
State Machine & Activity Diagrams for Logic ⚙️
Behavioral diagrams describe how the system reacts to events or processes data. State Machines are ideal for discrete logic, while Activity Diagrams suit continuous workflows.
Example: Fault Handling in Medical Devices 🏥
A medical infusion pump must handle power failures and blockages safely.
- States: Normal, Alarm, Pause, Emergency Stop.
- Transitions: Triggered by sensor input or time-out.
- Entry/Exit Actions: Log event, sound alarm, close valve.
This model ensures that every possible state transition is accounted for. It prevents “dead code” where a specific error state leaves the system in an undefined condition. Regulatory bodies often require this level of behavioral rigor for safety-critical systems.
Activity Diagram Use Case: Manufacturing Assembly 🏭
For a production line, an Activity Diagram maps the sequence of operations.
- Swimlanes: Robot Arm, Human Operator, Conveyor Belt.
- Parallel Flows: Welding and Painting happening simultaneously.
- Synchronization: Assembly only starts when both processes finish.
This highlights bottlenecks. If the painting process takes longer than welding, the model identifies the delay before the line is built.
Use Case Diagrams for Interaction 🤝
Use Case diagrams define the boundaries of the system and how actors interact with it. They are essential for defining scope.
Example: User Interface for Smart Home 🏠
Defining who controls what.
- Actors: Homeowner, Maintenance Technician, External App.
- Use Cases: Adjust Temperature, View Energy Usage, System Reset.
- Includes/Extends: “View Usage” includes “Login”.
This clarifies permissions. A Maintenance Technician might have access to “System Reset” but not “Adjust Temperature”. This prevents unauthorized access during the design phase.
Comparison of SysML Diagram Types
| Diagram Type | Primary Purpose | Common Engineering Application |
|---|---|---|
| Requirement Diagram | Define and trace needs | Regulatory compliance, Feature lists |
| Block Definition (BDD) | System structure and hierarchy | Hardware architecture, Subsystem definition |
| Internal Block (IBD) | Connections and flows | Wiring harnesses, Fluid paths, Data links |
| Parametric | Mathematical constraints | Thermal analysis, Load bearing, Power budget |
| State Machine | Discrete behavior and logic | Control software, Error handling, Modes |
| Activity | Workflow and processes | Manufacturing steps, Data processing pipelines |
| Use Case | Interaction and scope | User requirements, System boundaries |
Common Engineering Scenarios 🏗️
Applying these tools requires context. Here are three scenarios where SysML proves most effective.
1. Legacy System Integration
When integrating new technology into older infrastructure, documentation is often missing. Engineers can reverse-engineer the system by creating a “As-Is” model based on physical inspection. This model then serves as the baseline for the “To-Be” design. It reduces the risk of breaking existing functionality.
2. Cross-Disciplinary Collaboration
Mechanical, Electrical, and Software (MEK) teams often speak different languages. SysML acts as a lingua franca. A mechanical engineer defines the mass in the BDD. An electrical engineer defines the power draw in the IBD. The model aggregates these into a system-level view, ensuring the power supply can handle the mass and heat generated.
3. Risk Management
Every system has failure points. SysML allows the modeling of failure modes alongside normal operation. By linking failure states in State Machines to specific components in BDDs, engineers can perform Fault Tree Analysis directly from the model. This quantifies risk before physical prototyping.
Integration Strategies 🔌
Building a model is only half the battle. Integrating it into the workflow is the other half.
- Early Adoption: Start modeling during the concept phase. Do not wait for requirements to be finalized.
- Incremental Growth: Do not attempt to model the entire system at once. Build subsystems first, then integrate.
- Automation: Use scripts to generate documentation from the model. Keep the model as the single source of truth.
- Validation: Regularly verify that the model matches the physical build. Update the model when changes occur.
Avoiding Modeling Anti-Patterns 🚫
Even with the right tools, teams can make mistakes. Avoid these common pitfalls.
- Over-Modeling: Modeling every detail is unnecessary. Focus on the variables that change or impact safety.
- Document Substitution: The model is not a document generator. It is a simulation engine. Do not use it just to print PDFs.
- Lack of Governance: Without version control and review processes, models drift from reality.
- Siloed Models: Keep the model connected to the code repository and test databases. Isolated models become obsolete quickly.
Data Flow and Information Management 📡
Modern engineering generates massive amounts of data. SysML helps organize this data into meaningful structures.
- Configuration Management: Track different versions of the system (e.g., Flight Config A vs. Test Config B).
- Change Management: When a requirement changes, the model identifies all impacted blocks automatically.
- Traceability Matrix: Generate reports showing requirement coverage across all disciplines.
This reduces the administrative burden on engineers. Instead of manually updating spreadsheets, the model handles the relationships.
Conclusion: Building for the Future 🚀
SysML is not a magic solution, but it is a powerful framework for reducing complexity. By focusing on structure, behavior, and constraints, engineers can create systems that are safer, more reliable, and easier to maintain. The examples above demonstrate that the value lies not in the diagrams themselves, but in the discipline they enforce.
Every project has challenges. Whether it is thermal limits, safety regulations, or integration complexity, a structured model provides the clarity needed to solve them. Start small, focus on traceability, and let the model evolve with your system.
Key Takeaways 📝
- Traceability is King: Link requirements to design elements explicitly.
- Use the Right Diagram: Match the diagram type to the engineering question.
- Keep it Updated: A stale model is worse than no model.
- Collaborate Early: Involve all disciplines in the modeling process.
- Focus on Physics: Use parametric diagrams to validate physical constraints.
Engineering is about solving problems. SysML provides the tools to define those problems clearly and ensure the solutions work as intended.