


Systems Modeling Language (SysML) serves as a cornerstone for complex engineering projects. It provides a standardized way to represent system requirements, structure, behavior, and parametrics. Unlike standard programming, SysML focuses on visualizing the architecture of a system before implementation begins. This guide breaks down the core diagram types to help you navigate the landscape of systems engineering.
Whether you are involved in aerospace, automotive, or software-defined systems, understanding these visual representations is critical. Clarity reduces errors. Precision saves resources. This document outlines the essential diagrams, their specific purposes, and how they interconnect to form a complete model.
Understanding the Core of SysML 🏗️
SysML is built upon the Unified Modeling Language (UML) but extends it to cover general systems engineering needs. It is not tied to a specific programming language or hardware. Instead, it acts as a common language for stakeholders ranging from requirements engineers to hardware designers.
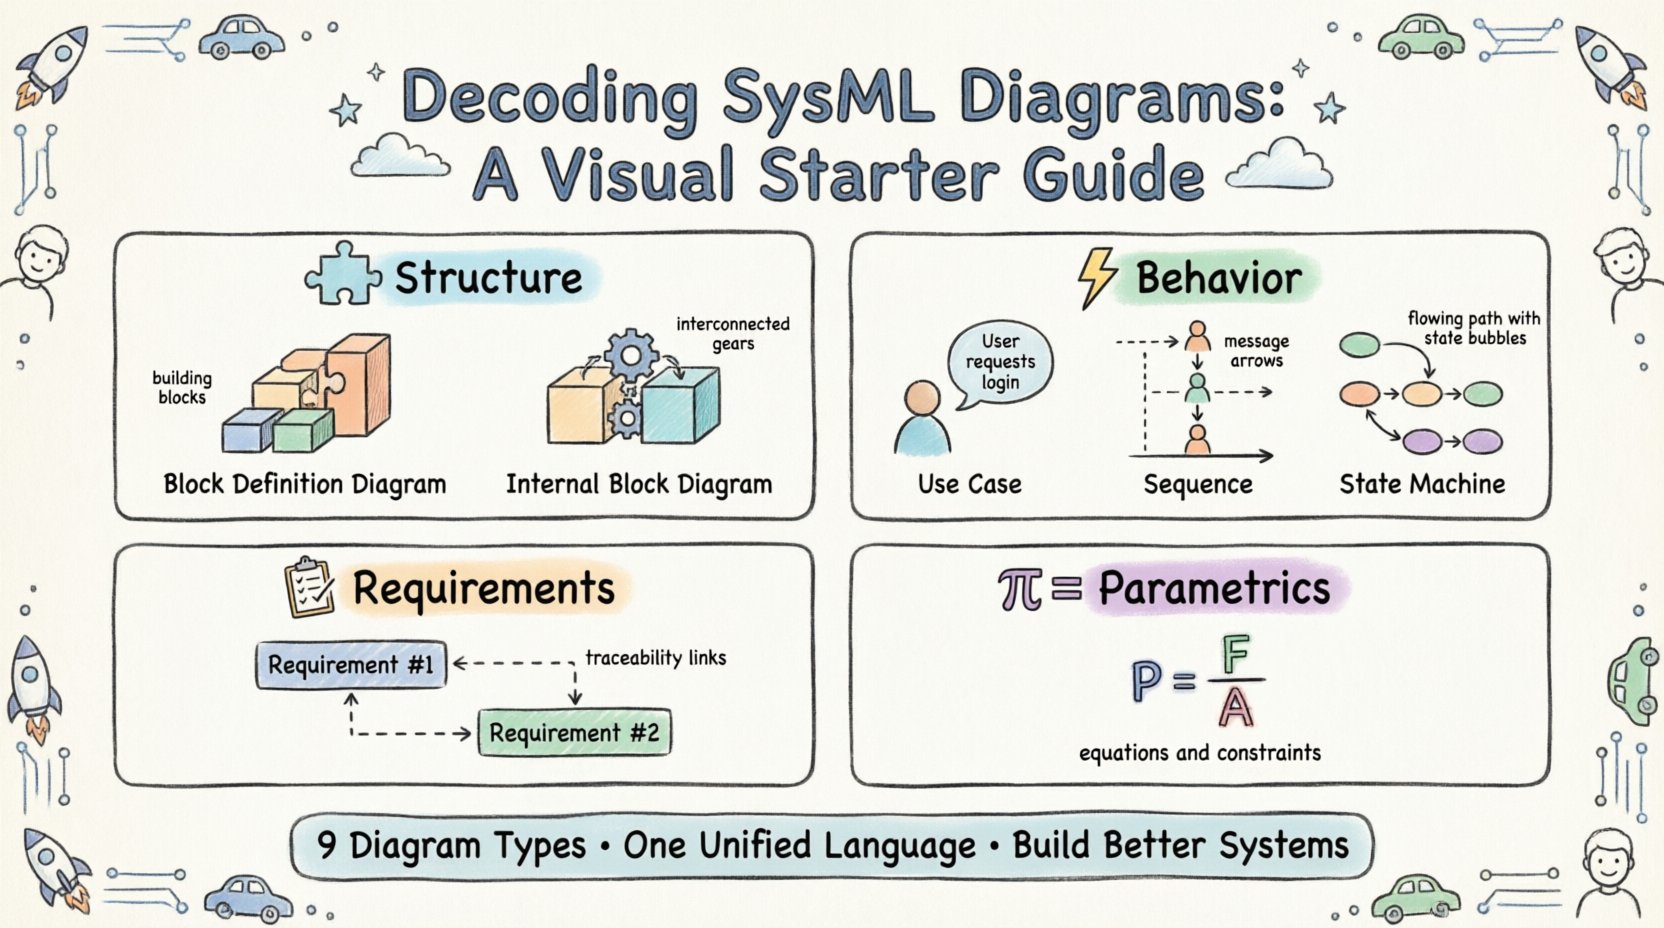
There are nine distinct diagram types within SysML. Each serves a unique function. Using the right diagram at the right time ensures that all aspects of a system are captured accurately. Below is a breakdown of the key categories:
Structure Diagrams: Define what the system is made of.
Behavior Diagrams: Define what the system does.
Requirement Diagrams: Define what the system must achieve.
Parametric Diagrams: Define mathematical constraints.
1. Block Definition Diagram (BDD) 🔲
The Block Definition Diagram is the foundation of SysML modeling. It describes the system structure at the highest level. In this diagram, you define the blocks. A block represents a physical or logical component. It can be a sub-system, a part, or a complete system.
Key elements within a BDD include:
Blocks: The primary units of structure. They encapsulate properties and operations.
Relationships: Links that define how blocks interact. This includes generalization (inheritance), composition (whole-part), and aggregation.
Properties: Attributes defined within a block that describe its characteristics.
Consider an aerospace vehicle. A BDD would list the main fuselage, the engine, and the avionics suite as blocks. It would then draw lines to show that the avionics suite is composed of the flight computer and the sensors. This hierarchical view allows engineers to see the parts list without getting lost in the details of how they connect physically.
When constructing a BDD, focus on the decomposition of the system. Break down complex entities into manageable sub-blocks. This approach supports modularity and reuse. If a component is used in multiple systems, defining it once in a BDD allows it to be referenced elsewhere without duplication.
2. Internal Block Diagram (IBD) 🔄
While the BDD shows the parts, the Internal Block Diagram shows how those parts fit together. It visualizes the internal structure of a block. This is where you define the flow of information and material between components.
Essential concepts in an IBD include:
Ports: Points of interaction. A port is a defined interface where connections can be made.
Connectors: Lines that link ports together. They represent the physical or logical link.
Flow Properties: Data or material moving through a connector.
For example, in a vehicle braking system, the IBD would show the brake pedal connected to the master cylinder. It would trace the hydraulic fluid flow to the calipers. This diagram is vital for understanding signal paths and data exchange. It moves the model from abstract structure to concrete interaction.
When designing an IBD, ensure that all ports are typed. A port type defines the kind of data or signal expected. This prevents mismatches where a digital signal is connected to an analog input. Consistency in typing is crucial for simulation and validation later in the process.
3. Requirement Diagram (RD) 📋
Requirements are the driving force behind many systems engineering projects. The Requirement Diagram allows you to capture, organize, and trace these requirements. It ensures that every design decision can be linked back to a specific need.
Key features of the RD include:
Requirements: Statements of need. They can be functional, performance, or constraint-based.
Traceability: Links between requirements and other model elements.
Satisfaction: Showing how a block or behavior fulfills a requirement.
Refinement: Breaking a high-level requirement into detailed sub-requirements.
Traceability is the most valuable aspect of this diagram. It answers the question: “Why does this exist?” and “Does this design meet the need?” Without this link, a system may drift from its original intent. By maintaining a clear trace, teams can validate that every feature adds value.
Use this diagram to manage changes. If a requirement changes, the trace links show exactly which blocks or behaviors are affected. This impact analysis is essential for risk management. It prevents unintended consequences when modifying a system.
4. Use Case Diagram (UCD) 🎯
Use Case Diagrams focus on the interaction between the system and external entities. They describe the goals of a user or actor when interacting with the system. This is often the first diagram created to understand the system’s purpose.
Core components include:
Actors: Users or external systems that interact with the model.
Use Cases: Specific functions or services provided by the system.
Associations: Lines showing which actors interact with which use cases.
Include/Extend: Relationships that show optional or mandatory behavior.
In a software context, an actor might be an administrator. The use case might be “Update Configuration.” In a mechanical context, an actor might be the operator. The use case might be “Emergency Stop.” These diagrams help define the scope of the project. They identify who the system serves and what it does for them.
Keep these diagrams high-level. Do not detail the internal logic of a use case here. Save that for sequence or state machine diagrams. The goal is to establish boundaries and interactions, not implementation details.
5. Sequence Diagram (SD) ⏱️
Sequence Diagrams depict interactions over time. They show how objects communicate with each other to perform a specific task. This is essential for understanding dynamic behavior and message passing.
Important elements are:
Lifelines: Vertical lines representing the existence of an object or actor over time.
Messages: Arrows showing the flow of information between lifelines.
Activation Bars: Rectangles on lifelines showing when an object is actively processing.
Combined Fragments: Boxes that define loops, conditions, or parallel processes.
When reading a sequence diagram, read from top to bottom. The vertical axis represents time. A message sent from the top to the bottom indicates a sequence of events. This helps identify bottlenecks or delays in a process.
This diagram is particularly useful for debugging. If a system fails to respond, the sequence diagram shows exactly where the communication breakdown occurred. It clarifies the order of operations. It ensures that initialization happens before execution and that cleanup occurs after completion.
6. State Machine Diagram (SMD) 🔄
Not all systems behave linearly. Some operate based on conditions and states. The State Machine Diagram models the lifecycle of a system or component. It shows how the system transitions from one state to another based on events.
Key definitions include:
States: Conditions during which the system performs an activity or waits for an event.
Transitions: Arrows moving between states triggered by specific events.
Events: Triggers that cause a transition, such as a signal or a timer.
Actions: Activities performed while in a state.
Consider an automated door. The states might be “Closed,” “Opening,” “Open,” and “Closing.” A sensor event triggers the transition from “Closed” to “Opening.” Another event triggers “Opening” to “Open.” This logic is often difficult to capture in text. The SMD visualizes the logic clearly.
Use this diagram for systems with complex control logic. It helps identify unreachable states or deadlocks. If a system can get stuck in a state without an exit, the diagram makes this obvious. It is a powerful tool for ensuring reliability and safety.
7. Parametric Diagram (PD) 📊
Parametric Diagrams introduce mathematical constraints into the model. They allow you to define equations and relationships between variables. This is used for performance analysis and optimization.
Features of the PD include:
Constraints: Mathematical expressions that must be satisfied.
Variables: Quantities that feed into or result from constraints.
Connectors: Links binding variables to constraints.
For a battery system, a parametric diagram might define the relationship between capacity, discharge rate, and temperature. It ensures that the design meets performance thresholds under various conditions. This moves the model from qualitative to quantitative.
This diagram is critical for systems where physical laws dictate performance. It allows engineers to run simulations based on the model. If the equations are correct, the simulation results reflect real-world physics. This reduces the need for physical prototypes in early stages.
Comparing Diagram Types 📑
To understand which diagram to use, it helps to compare their primary focus. The following table summarizes the distinctions:
Diagram Type | Primary Focus | Key Question Answered |
|---|---|---|
Block Definition (BDD) | Structure & Composition | What is the system made of? |
Internal Block (IBD) | Interconnection & Flow | How do the parts connect? |
Requirement (RD) | Needs & Traceability | Why does the system exist? |
Use Case (UCD) | User Interaction | Who uses the system and for what? |
Sequence (SD) | Dynamic Interaction | How does it work over time? |
State Machine (SMD) | Behavioral Logic | What are the possible states? |
Parametric (PD) | Performance Constraints | Does it meet physical limits? |
Best Practices for Modeling ✅
Creating a SysML model is a discipline. Following established practices ensures the model remains maintainable and useful. Poor modeling can lead to confusion and errors. Adhering to standards helps teams collaborate effectively.
Consider these guidelines:
Consistent Naming: Use clear, descriptive names for blocks and ports. Avoid abbreviations unless they are universally understood within the team.
Layering: Do not put all information on one page. Use inheritance and delegation to manage complexity. Keep high-level diagrams abstract and detailed diagrams specific.
Traceability: Always link requirements to design elements. A design without a requirement is a risk. A requirement without a design is a gap.
Version Control: Treat models like code. Changes should be tracked. Collaborative editing requires strict protocols to avoid conflicts.
Validation: Regularly check the model against the requirements. Does the current design still satisfy the initial needs?
Common Pitfalls to Avoid ⚠️
Even experienced engineers can fall into traps when working with SysML. Being aware of these issues helps prevent rework.
Over-Modeling: Creating too much detail too early. Start with the structure and requirements. Add behavior and parametrics as needed.
Disconnected Diagrams: Creating diagrams that do not link to each other. A BDD that does not reference the IBD is incomplete. All diagrams should form a cohesive network.
Ignoring Standards: Deviating from the SysML syntax can confuse readers. Stick to the standard notation to ensure compatibility.
Static Requirements: Treating requirements as fixed. Requirements evolve. Ensure the traceability links can handle updates.
Integrating the Diagrams 🧩
No single diagram tells the whole story. The power of SysML lies in the integration of these views. A complete system description requires multiple perspectives.
For instance, a requirement might drive the creation of a block. That block is defined in the BDD. Its internal connections are shown in the IBD. Its interaction with the user is captured in the UCD. Its timing behavior is detailed in the SD. Its logical states are mapped in the SMD. Its performance limits are calculated in the PD.
When these diagrams align, they create a digital twin of the system. This consistency allows for automated checks. It enables simulation. It supports verification and validation processes. The goal is a unified view where changes in one area propagate correctly to others.
The Role of Stakeholders 👥
Different team members rely on different diagrams. Understanding this helps in tailoring the model.
Requirements Engineers: Rely heavily on Requirement Diagrams to manage scope and traceability.
System Architects: Use BDD and IBD to define the architecture and interfaces.
Software Developers: Prefer Sequence Diagrams and State Machine Diagrams for logic implementation.
Test Engineers: Use Use Case and Requirement Diagrams to generate test cases.
Project Managers: Look at Requirement Diagrams to track progress and coverage.
By understanding who uses the model, you can ensure the right information is presented clearly. A diagram meant for a manager should be high-level. A diagram meant for a developer should be precise.
Conclusion on Visual Communication 📢
SysML diagrams are more than just drawings. They are a rigorous language for engineering. They reduce ambiguity. They facilitate communication across disciplines. They provide a blueprint for building complex systems.
Mastering these diagrams takes practice. It requires understanding the relationships between structure, behavior, and requirements. It demands discipline in naming and linking. But the payoff is a system that is well-defined, traceable, and verifiable.
Start with the basics. Focus on the Block Definition and Requirement diagrams. As you gain confidence, expand into the behavioral and parametric views. Use the tools available to you to visualize the data. Keep the model updated. Ensure it reflects the current state of the system.
By following these guidelines, you build a foundation for successful systems engineering. The visual language of SysML bridges the gap between idea and reality. It turns abstract concepts into concrete designs. It ensures that when the system is built, it works as intended.
Remember that the goal is not just to create diagrams, but to create understanding. Use them to ask questions. Use them to find answers. Use them to verify that the system meets the needs of the user. This is the essence of systems modeling.