


Imagine you’re a project manager facing a complex software development cycle. Your team is spread across time zones, and the project has dozens of interdependent tasks. How do you create a clear, shared understanding of the schedule without getting lost in spreadsheets? The answer lies in a simple, powerful tool: the Gantt Chart Builder. This web-based application transforms the daunting task of project planning into a streamlined, visual process. It allows you to define tasks, set dates, track progress, and generate a professional-looking timeline instantly. The best part? You can use it right now, no sign-up required. This guide will walk you through the entire process, from launching the tool to exporting your final chart, using the Visual Paradigm Gantt Chart Builder as your digital canvas.
Key Takeaways
-
Use the Interactive Task Editor to add and manage project tasks with details like titles, developers, and dates.
-
See your project timeline live update in real-time as you input data.
-
Customize the chart’s appearance with Timeline Properties like time unit and column width.
-
Save your project data locally as a JSON file and export a high-quality image for presentations.
Getting Started: Your Project’s First Steps
When you first open the Gantt Chart Builder, you’re greeted with a clean, intuitive interface designed for immediate productivity. The screen is split into two main sections, which you can see in the first image. The top section, labeled Timeline Properties, is your control center for the overall chart. Here, you can set the project’s start and end dates, choose the time unit (like day, week, or month), and adjust the step interval. You’ll also find the Column Width slider, which lets you fine-tune the visual spacing of your timeline. This is where you define the framework for your entire project.
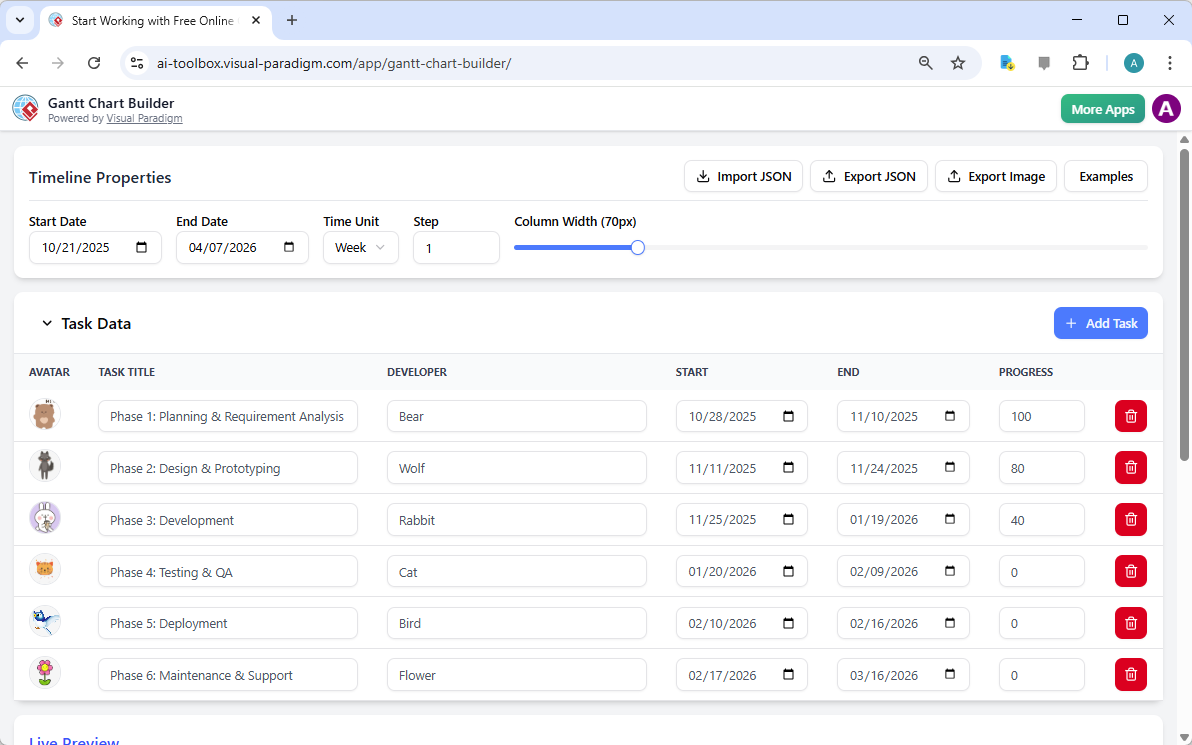
Below the timeline settings, you’ll find the Task Data section, which functions like a spreadsheet. This is where you input all the specifics of your project. Each row represents a single task, and you can easily add new ones by clicking the + Add Task button. For each task, you can define its title (e.g., “Phase 1: Planning & Requirement Analysis”), assign a developer (with a cute avatar), and set the start and end dates. You can also track progress with a percentage, which will be visually represented on the chart. The beauty of this setup is its simplicity. It’s like managing your project in a familiar table, but with the added benefit of a live preview.
Building Your Project Plan: From Data to Visual
Now that you’ve set the stage, it’s time to build your project plan. The real magic of the Gantt Chart Builder happens in the Live Preview section, which you can see in the second image. As you enter the details for each task in the Task Data table, the chart below updates instantly. This live feedback is incredibly powerful. You can see at a glance how your tasks overlap, identify potential bottlenecks, and ensure your timeline is realistic.
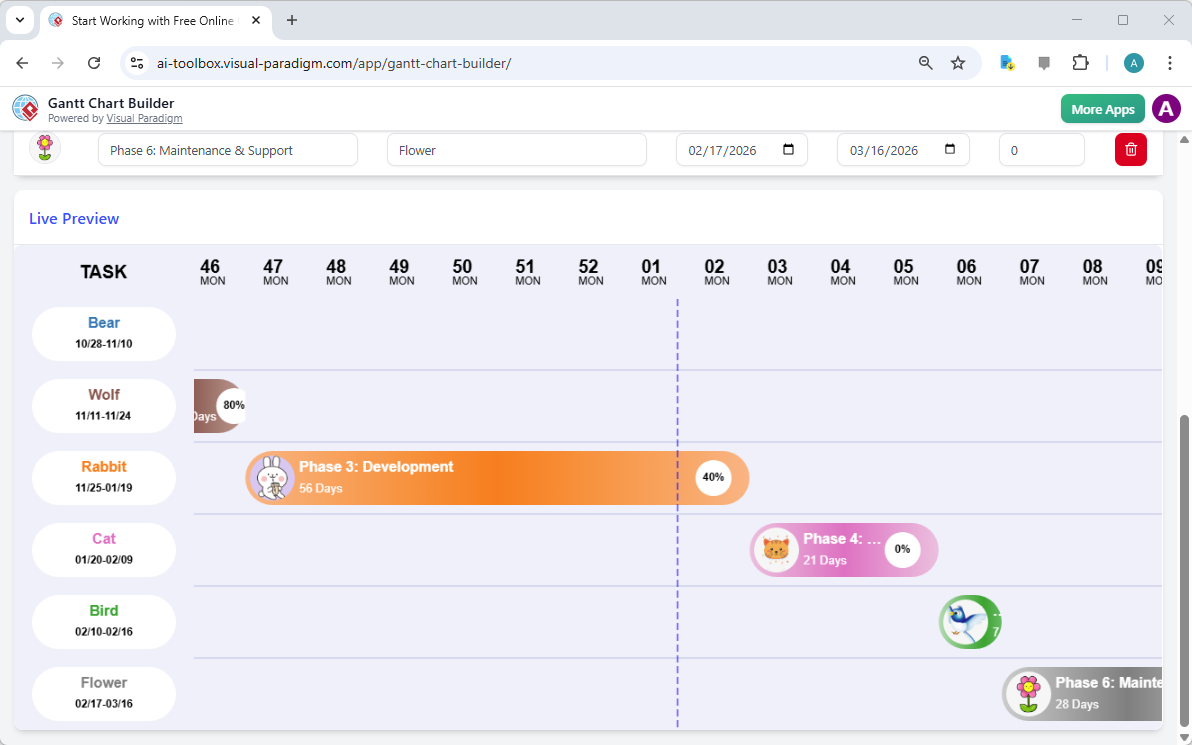
For example, in the image, you can see that “Phase 3: Development” is scheduled to run from November 25, 2025, to January 19, 2026, and it’s currently 40% complete. The bar for “Phase 4: Testing & QA” starts immediately after, and it’s just beginning. This visual representation makes it easy to communicate the project’s flow to your team or stakeholders. You can also see that the chart is using a weekly time unit, with the column width adjusted for clarity. If you want to switch to a monthly view, you can do so in the Timeline Properties section. The chart will instantly reformat to show a broader, more strategic view of your project’s timeline.
Tracking Progress and Customizing Your View
As your project progresses, the Gantt Chart Builder becomes an essential tool for tracking. You can go back to the Task Data table and update the progress percentage for each task. For instance, if “Phase 3: Development” is now 80% complete, you can update that field, and the bar on the chart will automatically extend to reflect the new progress. This provides a clear, visual record of your team’s accomplishments.
For deeper analysis, you can customize the chart’s appearance. In the Timeline Properties, you can change the Time Unit to “Month” to get a high-level view of your project’s phases, or switch to “Day” for a more detailed look at a specific sprint. You can also adjust the Step to control how frequently the timeline is marked (e.g., every 2 weeks). The Column Width slider allows you to make the timeline wider for more detail or narrower for a more compact view. These adjustments help you tailor the chart to the specific needs of your project and audience.
Exporting and Sharing Your Masterpiece
Once your Gantt chart is complete and perfectly customized, the final step is to share it. The Gantt Chart Builder offers two key export options. You can use the Export Image button to save your chart as a high-quality PNG or JPEG file. This is ideal for presentations, reports, or documentation. You can also use the Export JSON button to save your entire project data file locally. This is crucial for backing up your work and ensuring you have full control over your project plans. If you need to make changes later, you can simply Import JSON to load your project back into the tool.
For those who want to get started quickly, the Examples button provides a library of pre-built Gantt charts. You can load these as templates to see how the tool works or to use as a starting point for your own projects.
With the Visual Paradigm Gantt Chart Builder, you have a powerful, easy-to-use tool to plan, track, and communicate your project schedule. Whether you’re a project manager, team leader, entrepreneur, or student, this web-based application can help you bring your project to life with a clear, visual timeline. It’s time to stop wrestling with spreadsheets and start visualizing your success.
Ready to create your own project timeline? Try the Gantt Chart Builder now and see how easy project planning can be.
Related Links
Gantt charts are essential project management tools used to plan, visualize, and track project timelines by scheduling tasks and managing dependencies. Modern solutions integrate AI-driven automation for instant scheduling and cloud-based platforms for real-time team collaboration across various industries.
-
Practical Guide to Gantt Charts: Master Project Planning & Scheduling: A comprehensive resource for understanding the benefits, effective construction, and best practices of using charts for management.
-
AI-Powered Gantt Chart Builder – Instant Project Planning Tool: This tool leverages artificial intelligence to generate complete Gantt charts instantly from simple task inputs.
-
Visual Paradigm Gantt Chart Tool – Create & Manage Project Timelines: A professional toolset designed to help users plan and track project progress efficiently through a visual interface.
-
Online Gantt Chart Tool – Real-Time Collaboration & Project Planning: A cloud-based solution that allows distributed teams to collaborate in real time on task scheduling and management.
-
Gantt Chart Builder – Build Custom Project Timelines Easily: This feature enables the creation of dynamic, interactive schedules using intuitive drag-and-drop functionality.
-
Free Gantt Chart Templates – Ready-to-Use Project Planning Tools: Access a library of downloadable and customizable templates to jumpstart project planning with minimal setup.
-
Explore Gantt Chart Maker – Create Professional Charts Online: An overview of an online platform for building professional charts with advanced tracking and collaboration features.
-
Gantt Chart Templates – Customize & Use for Any Project: A versatile collection of templates tailored for various industries and project types in an online library.
-
How to Use Visual Paradigm Gantt Chart Tool – Video Tutorial: A step-by-step video guide walking users through the process of creating and managing projects using the software.
-
Timeline Diagram Software for Visual Planning: A specialized tool for creating interactive timelines to manage project milestones, deadlines, and schedules effectively.