Building an org chart used to mean endless dragging, aligning, and praying the lines don’t turn into a mess. Not anymore. Visual Paradigm’s AI Organization Chart Generator takes your simple description and builds a sharp, hierarchical structure in seconds — perfectly balanced, logically connected, and ready to impress.
Whether you’re mapping a university admin, a growing startup, or a global corporation, this AI-powered tool removes the pain and delivers a professional result every time. No graphic design degree required.
Why This AI Org Chart Tool Wins
- Plain text → instant, structured hierarchy
- Smart detection of reporting lines and levels
- Desktop precision or chatbot speed — your choice
- 100% editable boxes, lines, colors, photos
- Beautiful layouts that scale from 5 to 500+ positions
1. Desktop: From Prompt to Polished Structure
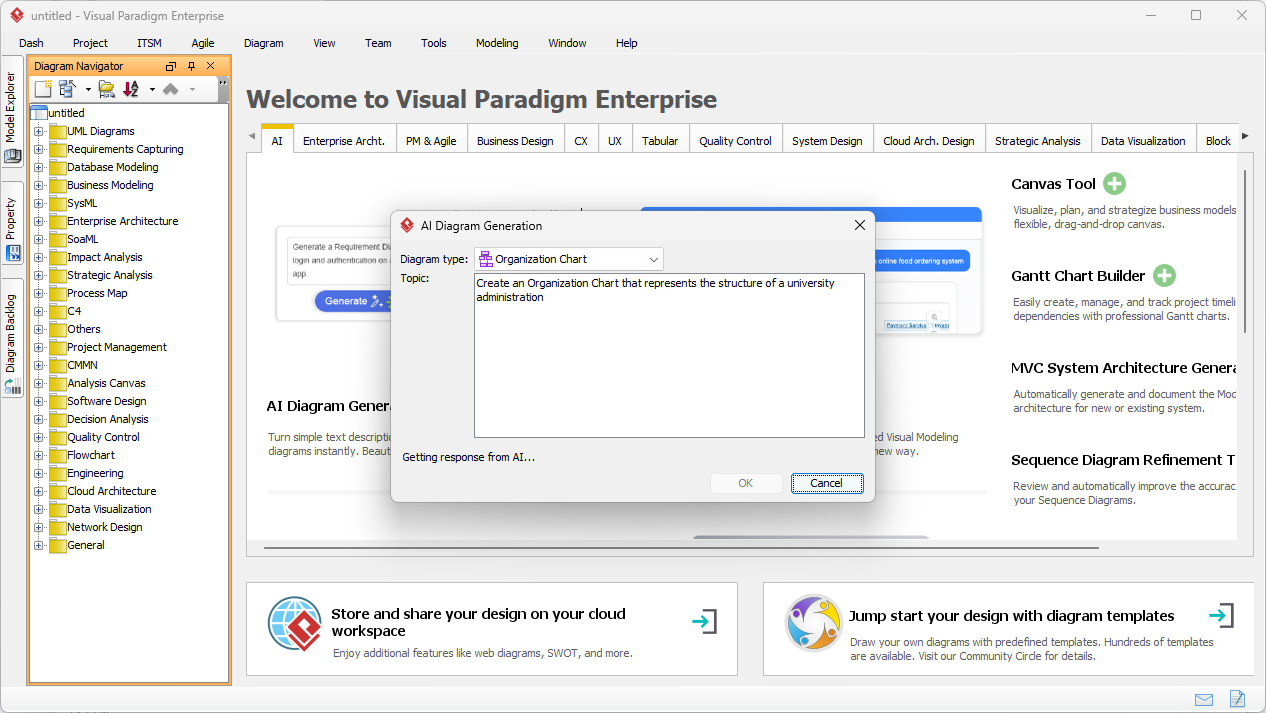
Fire up Visual Paradigm Desktop → Tools → AI Diagram Generation → pick “Organization Chart” → enter your description:
“Generate an organization chart for a university administration including central admin, student services, academic departments, finance, facilities, and all sub-units.”
The input window is clean and focused:
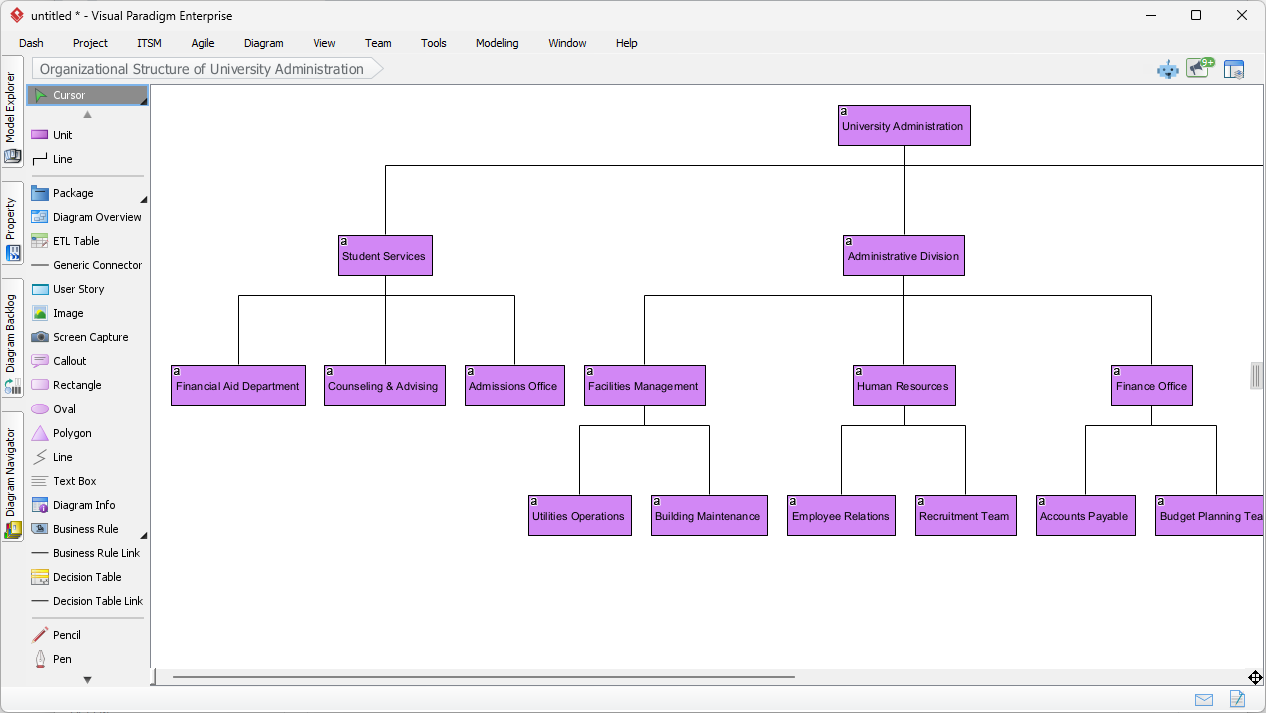
AI instantly creates:
- Top-level: University Administration
- Main branches: Student Services + Administrative Division
- Deep hierarchy: Financial Aid → Counseling → Facilities Management → Utilities Operations
- Balanced vertical layout with clear reporting lines
Final generated university org chart — crisp and professional:
Want to add names, photos, change colors, or insert dotted-line matrix reporting? Everything is fully editable in seconds.
2. Chatbot: Quick Charts on Any Device
Need a fast visual during a meeting or from your phone? Open the Visual Paradigm AI Chatbot in your browser.
Type:
“Create organization chart for TechNova Solutions: CEO, Operations Division, Technology Division, Sales & Marketing, HR with Recruitment Team, IT Infrastructure with Cloud Services.”
The chatbot understands, builds the full structure, and shows it right there. Example output for a modern tech company:
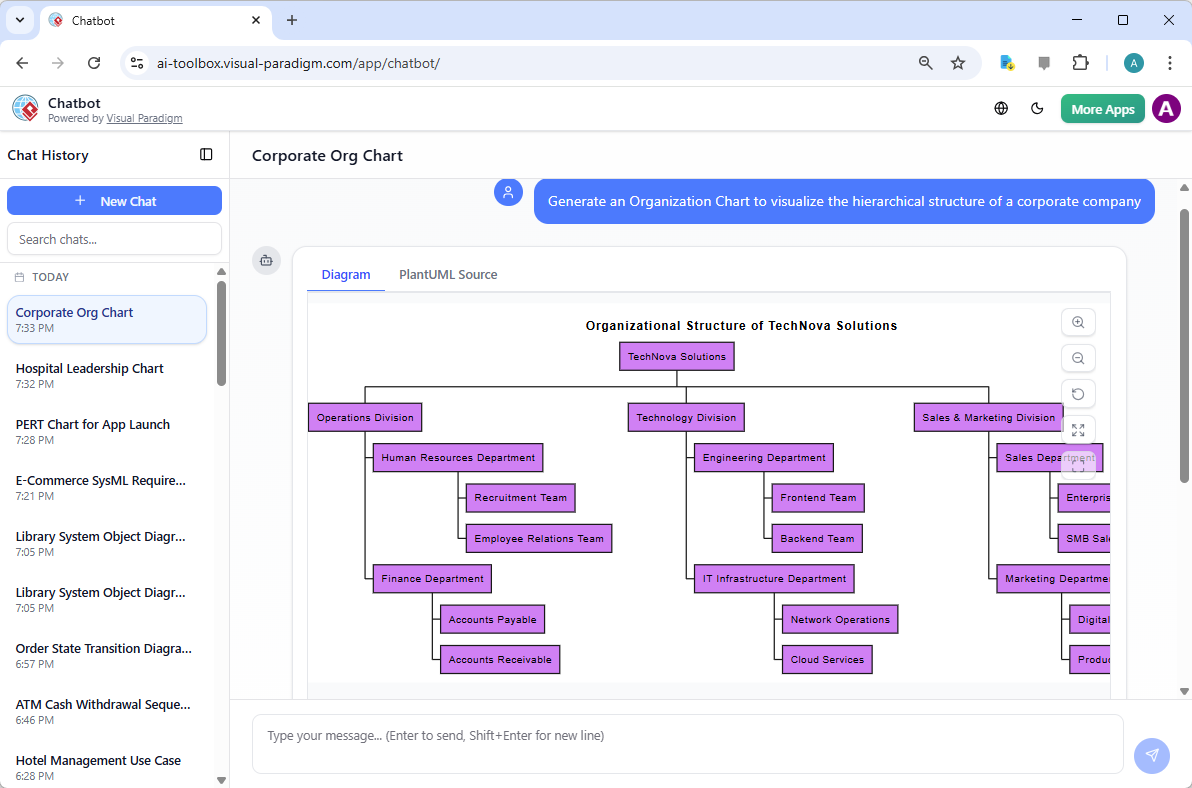
Refine live: “Add dotted line from HR to Operations for project support.” Instant update. Perfect for brainstorming, quick updates, or showing stakeholders on the spot.
Real-World Power: Save Hours, Look Pro
HR teams use this to visualize restructures in minutes. Executives create “what-if” flatter or deeper versions before decisions. Managers export polished PDFs for handbooks or presentations — all without fighting alignment tools.
Simple Workflow to Master
- Describe structure (text prompt or chat)
- Generate base chart
- Customize: names, photos, colors, dotted lines
- Export or embed in reports
Ready to Map Your Team Like a Pro?
Visual Paradigm’s AI Organization Chart Generator makes complex hierarchies simple, fast, and beautiful — whether for universities, corporations, startups, or non-profits.
- Download Visual Paradigm Desktop → Full editing power: Get Desktop Now
- Try AI Chatbot → Instant browser magic: Start Chatting
Stop struggling with messy charts. Start creating clear, professional org structures — today.
Related Links
The integration of artificial intelligence into organizational modeling has revolutionized how teams visualize company hierarchies and departmental structures. According to the sources, AI-powered tree diagram makers and automated generators can transform natural language descriptions into professional charts in seconds. By utilizing collaborative smart boards and intelligent templates, organizations can streamline their workflows, optimize hierarchical data analysis, and maintain real-time updates for their workforce documentation.
- Automate Organizational Charts with Visual Paradigm AI – Watch the Demo: This article highlights how Visual Paradigm’s AI automates the creation of organizational charts and provides real-time updates through intelligent design capabilities.
- Automate Organizational Charts with Visual Paradigm AI Demo: This resource provides a demo of AI tools that streamline workflows by automatically managing and creating organizational hierarchies.
- AI Tree Diagram Maker | Visualize Hierarchical Data Instantly: The AI Tree Diagram Maker allows users to visualize hierarchical data instantly by describing topics to generate professional org charts.
- Comprehensive Tutorial: How to Master AI Tree Diagram Maker – IntelliTree: This comprehensive tutorial explains how to master IntelliTree, an AI-powered tool that transforms natural language into structured organizational charts.
- AI Tree Diagram Maker Home: The AI Tree Diagram Maker platform offers users a way to create and analyze hierarchical data using specialized templates for organizational structures.
- Online Organization Chart Maker – Create Professional Org Charts Easily: Users can create professional-grade organization charts using a web-based tool that features drag-and-drop functionality and customizable templates.
- How to Create an Org Chart Using Visual Paradigm Smart Board: This step-by-step guide walks users through building organization charts using the Smart Board to facilitate collaborative design sessions.
- Streamline Organizational Structure with Smart Boards: This resource explains how to streamline and optimize organizational hierarchies and workflows using the visual capabilities of the Smart Board.
- Creating an Organizational Chart for a School Department Using Smart Board: This guide provides specific instructions for creating professional charts for school departments using collaborative visual planning tools.
- Visual Paradigm User Guide – Organization Chart Creation: The official user guide offers a comprehensive walkthrough on the manual creation and customization of organization charts within the modeling environment.