


Imagine turning a complex project idea into a fully structured, detailed diagram in seconds. That’s the power of Visual Paradigm’s AI Tree Diagram Maker, an online tool that transforms how you organize and analyze hierarchical data. This AI-powered software isn’t just another diagramming app; it’s a dynamic workspace that generates, visualizes, and analyzes your ideas. The images show a real-world example of this in action: a comprehensive Requirement Management tree for a Hotel Room Booking System. You start by entering a topic, and the AI instantly generates a detailed, structured diagram. The dual-view interface—text editor on the left, visual tree on the right—ensures your ideas are captured quickly and seen clearly. But the real magic lies in the ability to dive deep into each node, analyze your project, and even chat with your data. This is the ultimate tool for anyone who needs to structure complex information with speed and intelligence.
Quick summary: Key features of the AI Tree Diagram Maker
-
Generate entire diagrams instantly with AI from a simple topic
-
Use a dual-view editor for real-time text and visual synchronization
-
Detail nodes with properties like priority, status, and comments
-
Get AI-generated insights and analysis of your entire project
-
Ask an AI chatbot questions about your data in plain English
How the AI Tree Diagram Maker Works: A Step-by-Step Look
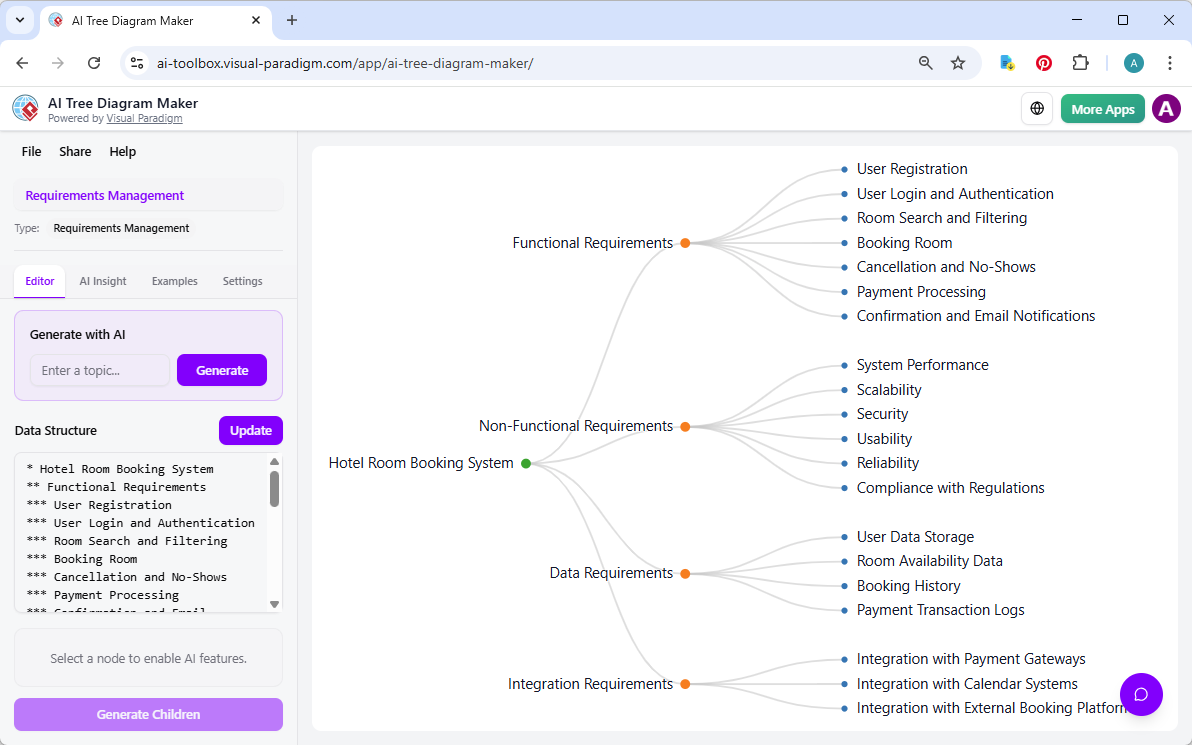
Let’s break down the process shown in the images. The first step is to launch the AI Tree Diagram Maker and select a blueprint. For a project like Requirement Management, you would choose a template that fits the task. In the first image, we see a “Requirements Management” project already loaded. The user has entered the topic “Hotel Room Booking System” and used the “Generate with AI” button to create a complete, structured tree. This is a massive time-saver, as the AI instantly generates a detailed hierarchy with branches for Functional Requirements, Non-Functional Requirements, Data Requirements, and Integration Requirements. The diagram is immediately visualized on the right, showing a clear, hierarchical structure that is easy to understand and navigate.
Image 1: The AI Tree Diagram Maker in action, generating a Requirement Management tree.
Detailing Your Nodes for Maximum Insight
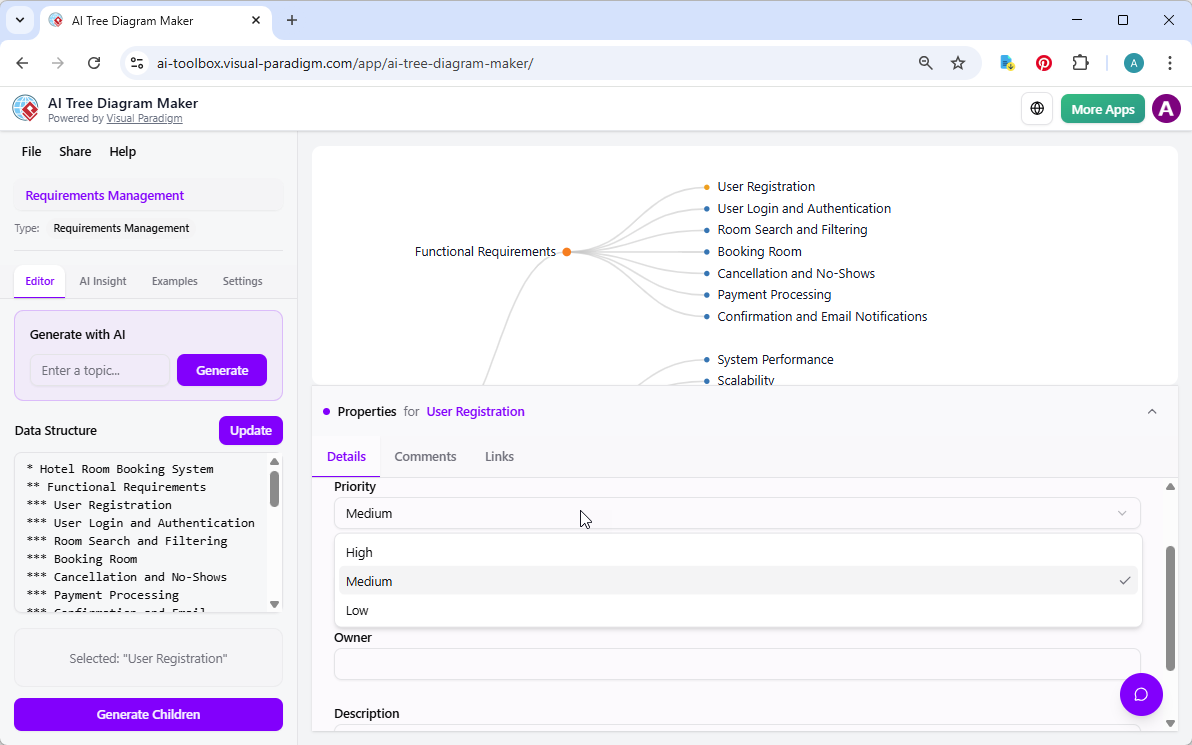
Once the initial structure is in place, the real work begins. The second image shows the user selecting the “User Registration” node. This is where the tool’s power goes beyond simple visualization. By clicking on a node, the user opens the Property Editor at the bottom of the screen. This panel allows you to add rich metadata to each item in your tree. You can set the “Priority” to High, Medium, or Low, update the “Status” to “In Progress” or “Done,” add a detailed “Description,” and even attach “Comments” and “Links.” This transforms a simple outline into a living, detailed project plan. This level of detail is crucial for project managers, business analysts, and software architects who need to track tasks, assign responsibilities, and monitor progress. The ability to add this context directly to the visual diagram ensures everyone on the team has the information they need.
Image 2: Detailing a node with properties like Priority and Status.
Conversing with Your Data: The AI Assistant
But the tool doesn’t stop at creating and detailing a diagram. The third image reveals its most innovative feature: the AI Assistant. This is a chatbot that understands your project’s structure and content. In this example, the user has asked the AI to “Estimate the time needed to fully implement the functional requirements.” The AI doesn’t just give a generic answer; it analyzes the data in your diagram. It notes that while the functional requirements are listed, the data doesn’t include time estimates for implementation. It then provides a thoughtful analysis, explaining that a proper time estimate would require additional context like feature complexity and team size. This is a powerful feature for project planning, as it allows you to get a second opinion on your work and identify potential gaps in your analysis.
Image 3: Asking the AI Assistant for a work plan estimation.

Why This AI-Powered Tool is a Game-Changer
For anyone who needs to organize complex information, the AI Tree Diagram Maker offers a significant advantage. It’s not just about making a pretty picture; it’s about creating a smart, interactive knowledge base. The dual-view editor allows for lightning-fast ideation and organization. The ability to add detailed properties to each node turns the diagram into a project management tool. And the AI Insight and chatbot features provide a level of analysis and interaction that is unmatched by traditional diagramming software. This is particularly valuable for project managers creating Work Breakdown Structures (WBS), business analysts mapping out decision trees, or software architects outlining system architectures. It’s a professional-grade tool that makes complex tasks feel effortless.
Get Started with the AI Tree Diagram Maker Today
If you’re ready to transform how you organize your ideas and projects, the AI Tree Diagram Maker is the perfect solution. It’s a powerful, AI-powered online tool that lets you create, analyze, and interact with hierarchical data with unprecedented speed and intelligence. Whether you’re planning a project, analyzing a business process, or structuring a complex document, this tool will save you time and provide deep insights. Don’t just take our word for it—try it yourself. Visit the AI Tree Diagram Maker to create your own interactive diagram and experience the power of AI-driven organization.
Try the AI Tree Diagram Maker Now
Related Links
Visual Paradigm offers an AI-powered tree diagram maker, which is designed to transform natural language descriptions into structured, professional hierarchical diagrams. These tools enable users to visualize complex hierarchical data instantly, covering a wide range of applications such as organizational charts, mind maps, and Work Breakdown Structures (WBS). Features like the Symbol tool further streamline the process by allowing users to rapidly convert hierarchical text into clean, editable diagrams through an intuitive editing interface. Additionally, the platform provides specialized support for decision trees, family trees, and risk registers, ensuring that users can effectively map outcomes, genealogy, or risk hierarchies.
-
AI Tree Diagram Maker – Visualize Hierarchical Data Instantly: An overview of the AI-driven tool that generates mind maps, org charts, and WBS diagrams from text descriptions.
-
From Text to Diagram: How Symbol Makes Hierarchy Editing Fast and Intuitive: A guide on using the Symbol feature to convert hierarchical text into editable tree diagrams.
-
Visualizing Complex Ideas with AI-Powered Tree Diagrams: An exploration of how AI-driven tree diagrams help break down complex concepts into clear visual structures.
-
Comprehensive Tutorial: Mastering the AI Tree Diagram Maker (IntelliTree): A detailed tutorial on transforming natural language into professionally formatted hierarchical diagrams using interactive visualization.
-
Risk Register Template with Tree Diagram Visualization: Details on using tree diagrams to visualize risk hierarchies and mitigation plans within a risk register.
-
Decision Tree Software for Visual Modeling: A resource for building and analyzing decision trees to improve structured problem-solving.
-
Family Tree Maker for Visual Documentation: A tool specifically designed for creating detailed genealogical structures with customizable relationships.
-
Free Tree Chart Tool – Visual Paradigm Smart Board: An intuitive, web-based platform for creating and customizing various hierarchical tree structures.