


Introduction
In today’s content-saturated digital landscape, the ability to communicate complex ideas through clean, compelling visuals isn’t just a nice-to-have—it’s essential. Yet for many professionals, educators, and creators, the gap between having an idea and producing a polished infographic feels frustratingly wide. That’s where AI-powered design tools promise to bridge the divide.
Over the past few weeks, I put Visual Paradigm’s AI Infographic Generator through its paces to see if it truly delivers on its promise: turning notes and prompts into professional visuals without requiring design expertise. This review shares my hands-on experience, practical workflows, and honest take on who benefits most from this tool—and where it might fall short.
First Impressions: The Interface & Getting Started
Upon landing on the tool, the interface feels refreshingly uncluttered. Unlike some AI design platforms that overwhelm users with endless toggles, Visual Paradigm opts for a focused, three-step workflow that guides you from concept to completion. The “Try It Now” call-to-action leads directly into the editor—no mandatory sign-up wall for initial exploration, which I appreciated as a time-pressed reviewer.
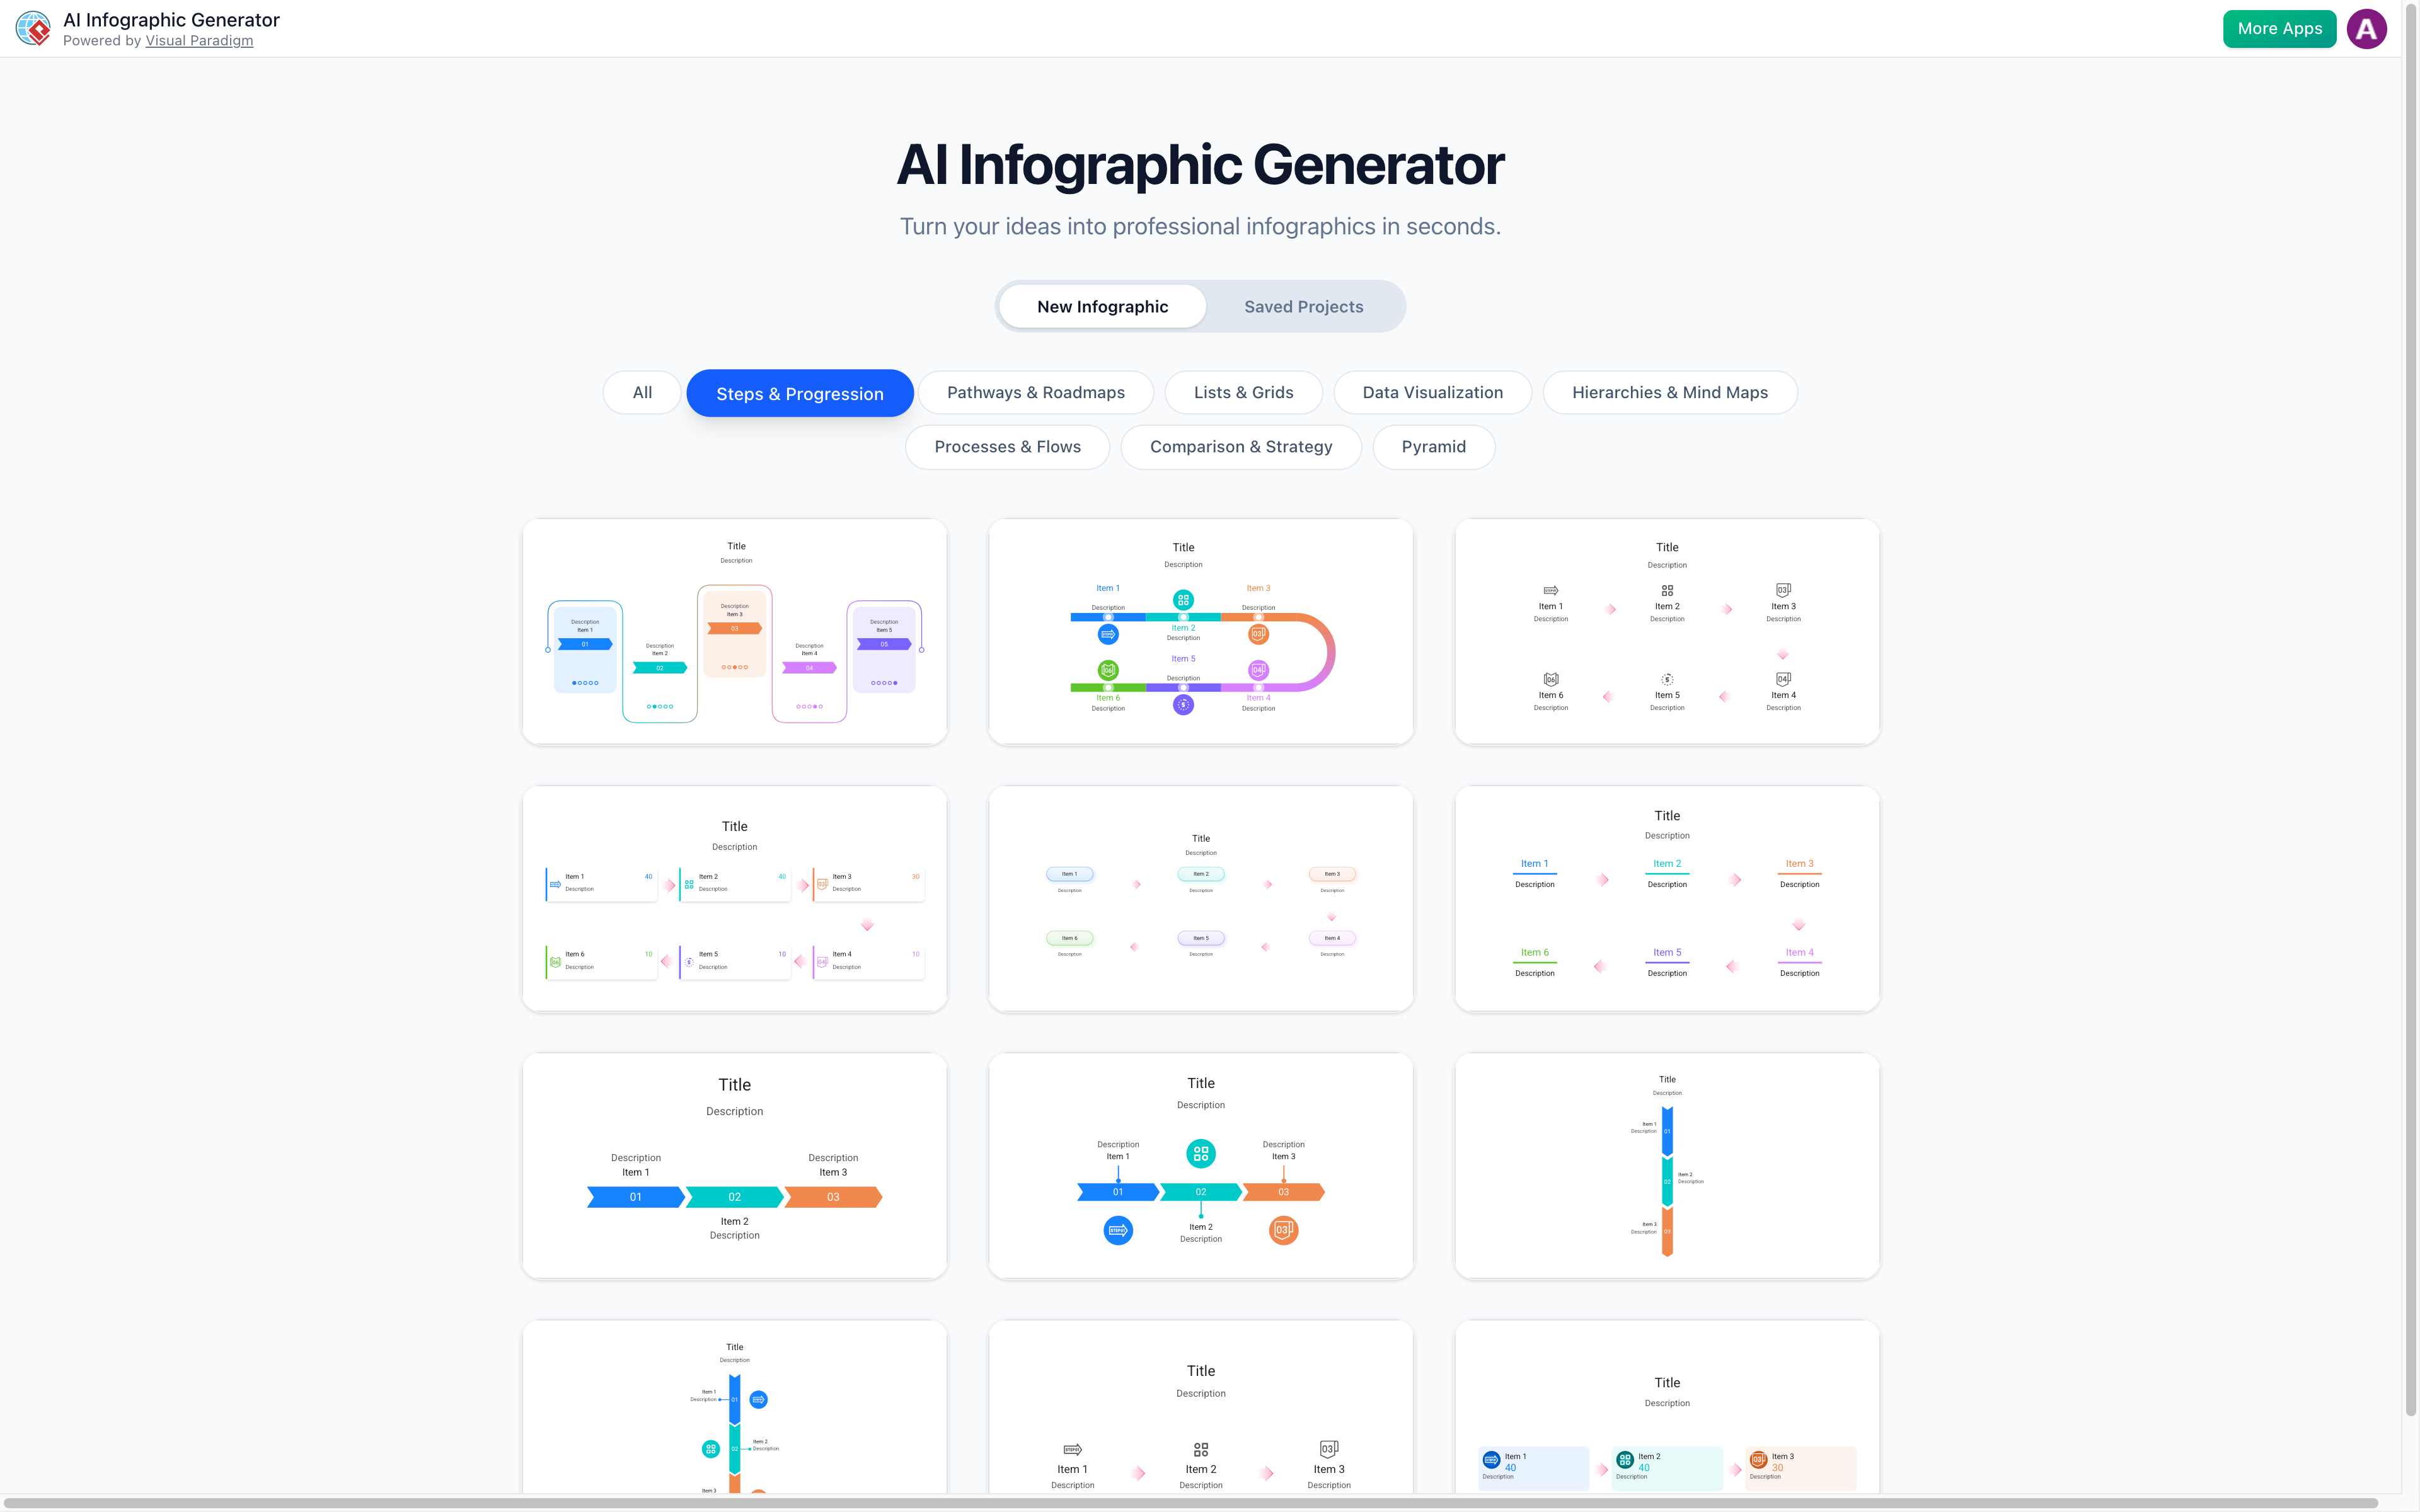
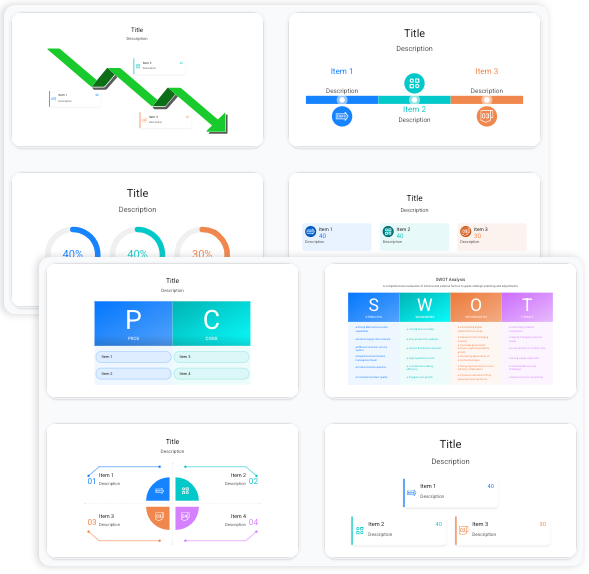
The dashboard immediately showcases supported infographic categories:
-
Steps & Progression
-
Pathways & Roadmaps
-
Lists & Grids
-
Data Visualization
-
Hierarchies & Mind Maps
-
Processes & Flows
-
Comparison & Strategy
-
Pyramid
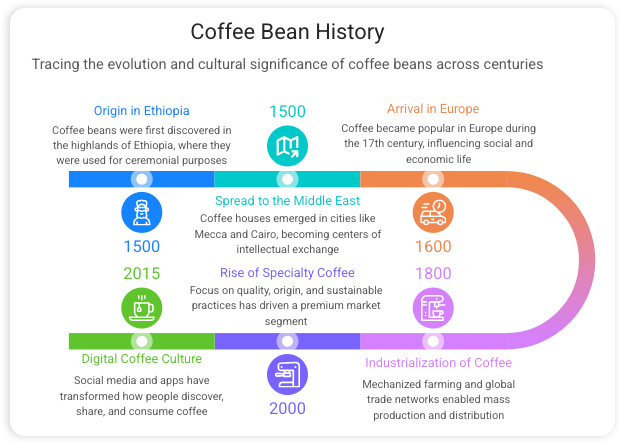
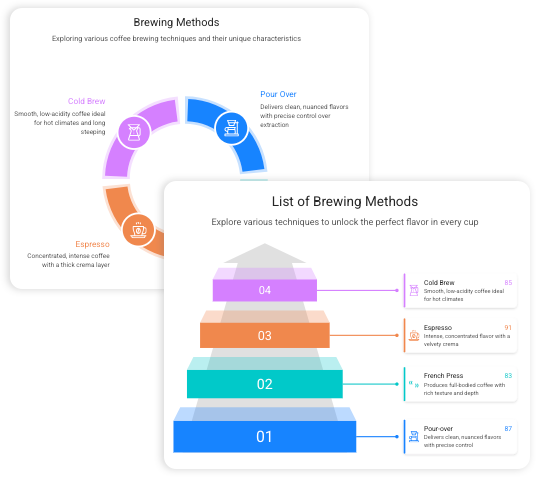
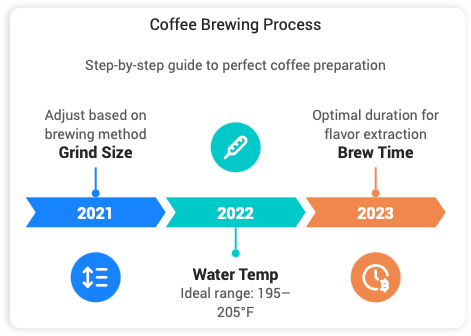
For someone drafting a “How-to” guide or mapping a project timeline, starting with a pre-structured category saves significant mental overhead. I tested the “Steps & Progression” template with a prompt about launching a community garden project, and the AI generated a logical six-step flow within seconds.
The Three-Step Creation Process: Streamlined and Intuitive
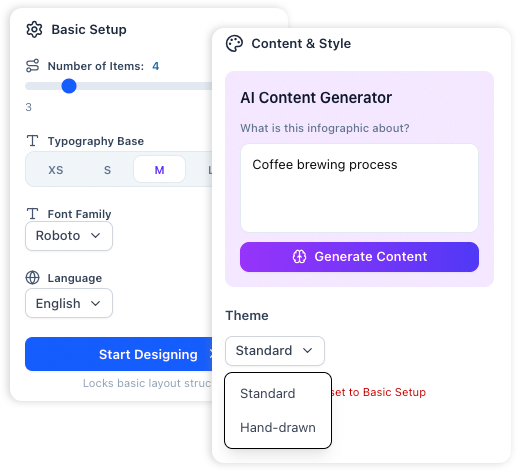
One of the most significant updates users will notice is the unified interface. Settings and the editor now live on a single screen, eliminating the back-and-forth that plagued earlier versions.
Step 1: Select Your Template
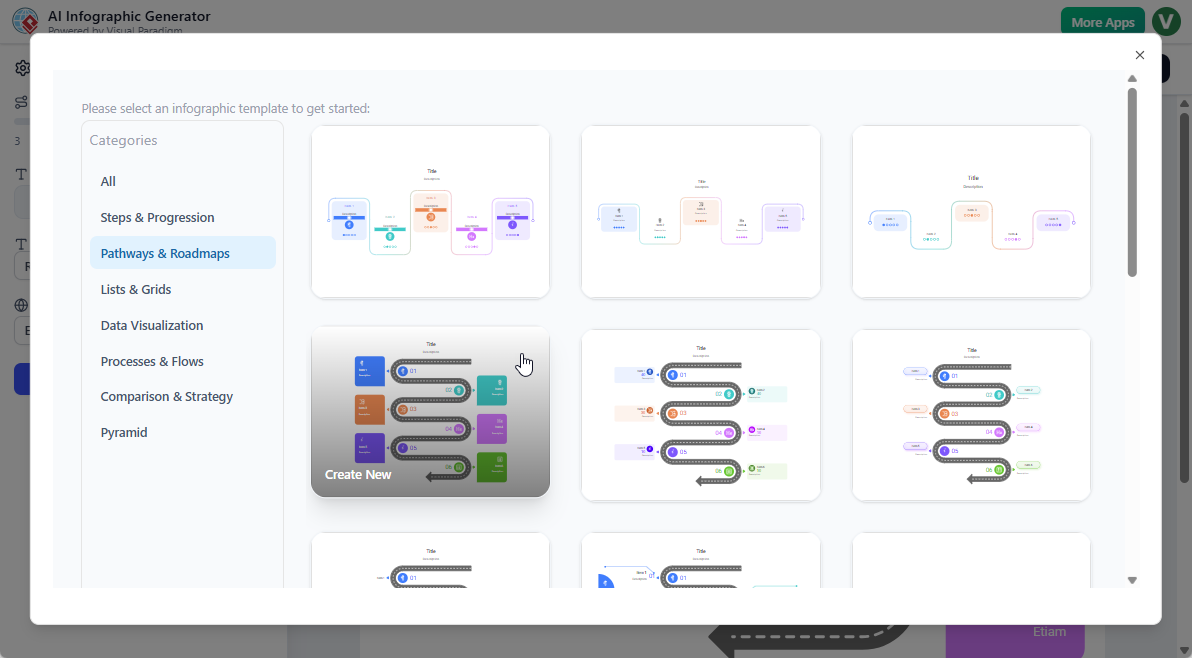
The template gallery is well-organized by use case. Hovering over any option shows a live preview. I found the filtering by category particularly helpful when narrowing down options for a data-heavy report versus a casual blog graphic.
Step 2: Customize & Preview in Real-Time
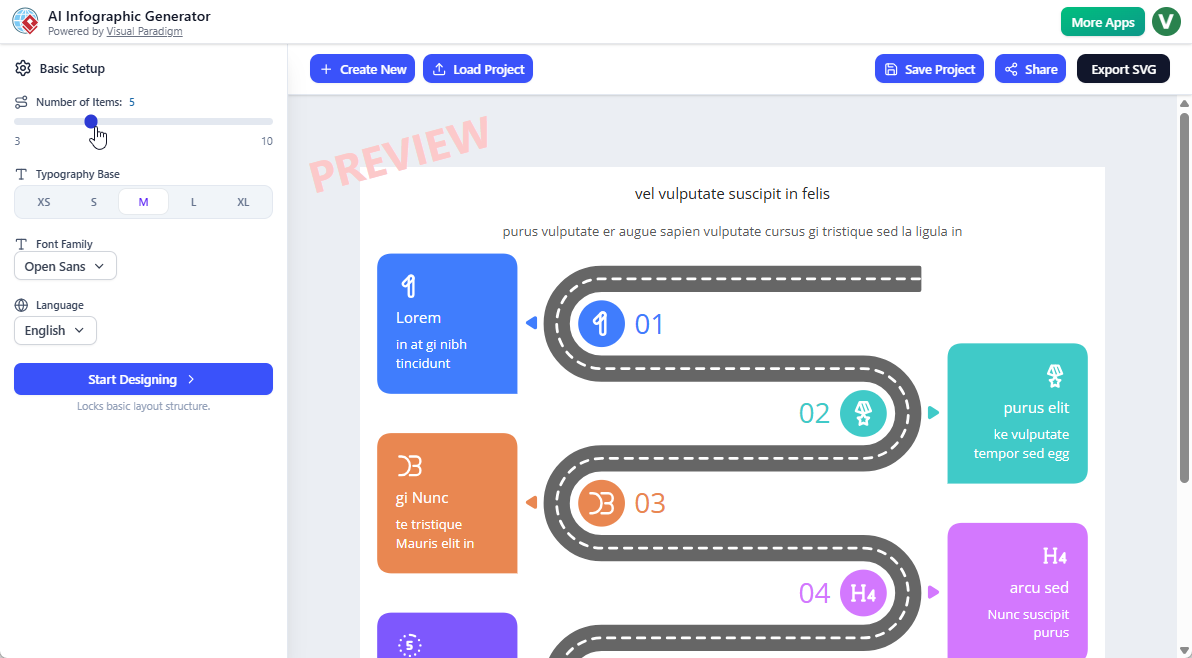
This is where the tool shines for iterative creators. The side pane lets you adjust:
-
Number of elements (add/remove sections with one click)
-
Font family and size
-
Language preferences
-
Color theme direction
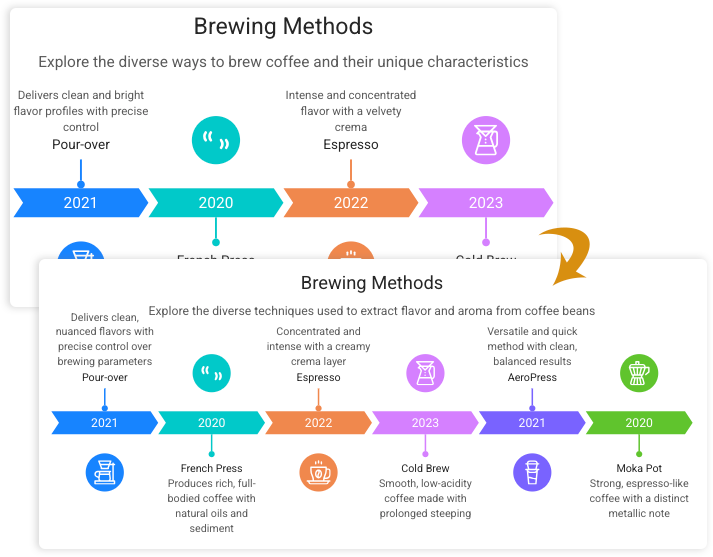
Changes reflect instantly in the preview pane. When I expanded a 4-step process to 6 steps, the layout auto-adjusted spacing and alignment—no manual dragging required. This “flexible layout” feature addresses a common pain point in rigid template tools.
Step 3: Generate & Refine
Clicking “Start Designing” triggers the AI content engine. You can either:
-
Let AI generate titles, descriptions, and data points from your prompt
-
Manually input your own content into the pre-structured layout
I tested both approaches. For a prompt like “Explain the benefits of remote work for tech teams,” the AI produced surprisingly coherent bullet points with relevant stats. That said, I still edited ~30% of the output for brand voice alignment—a realistic expectation for any AI content tool.
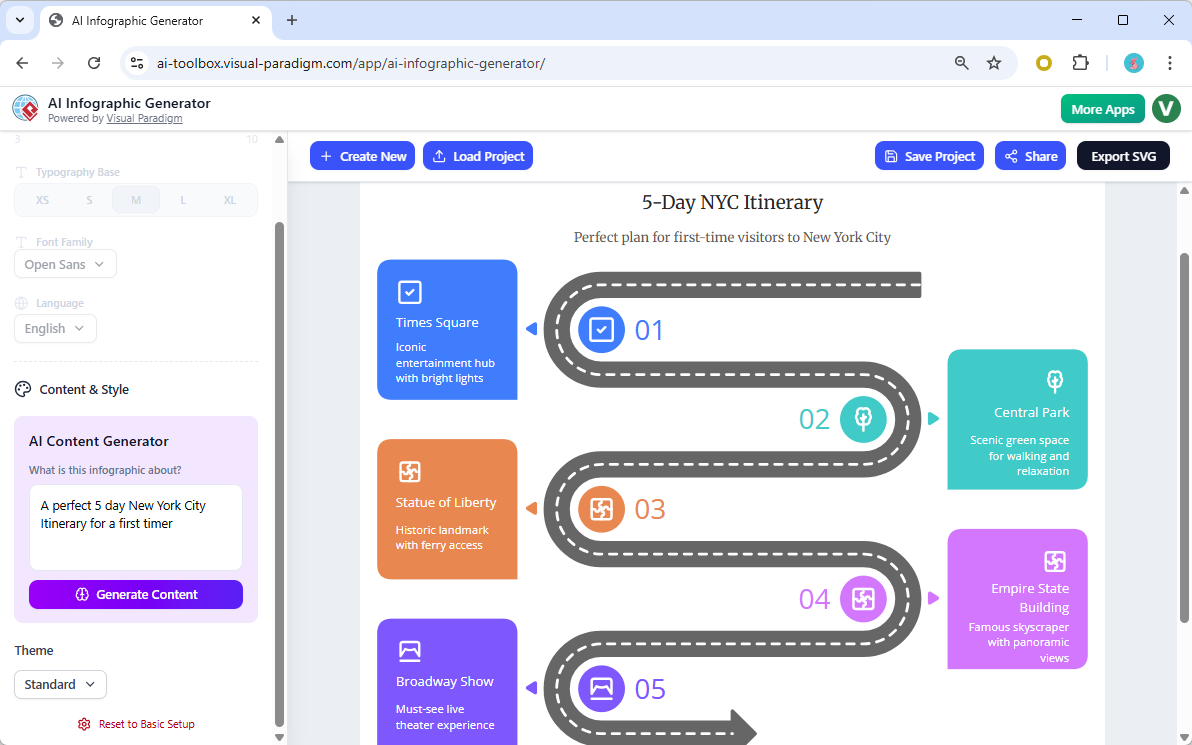
AI Content Generation: Smart Assistance, Not Replacement
The “Let AI Write Your Story” feature combines two capabilities I found genuinely useful:
Smart Research: The AI pulls relevant facts and statistics for your topic. When I prompted “sustainable packaging trends 2026,” it included recent industry data points I hadn’t manually sourced.
Structured Layouts: Beyond just text, the AI organizes content into logical visual flows. A comparison prompt automatically generated a two-column layout with pros/cons formatting.
Honest note: The AI isn’t perfect. For highly niche topics or brand-specific messaging, expect to refine outputs. But as a first-draft accelerator? It significantly reduces blank-page anxiety.
Design Flexibility: Professional Polish or Hand-Drawn Charm
One pleasant surprise was the style versatility. Rather than locking users into one aesthetic, the tool offers distinct visual directions:
Professional Style
Clean lines, structured grids, and corporate-friendly palettes. Ideal for:
-
Business reports
-
Investor decks
-
Formal presentations
-
Data-driven executive summaries
Hand-Drawn Style (New Feature)
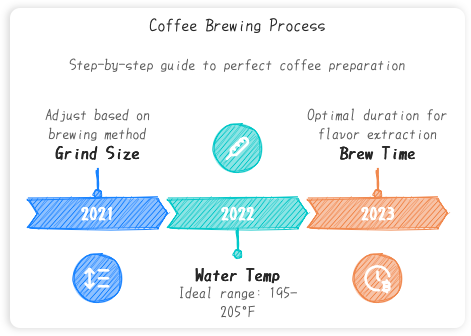
This newly added option injects warmth through sketched shapes and organic lines. I used it for a community workshop flyer, and the approachable aesthetic resonated better with my audience than a rigid corporate layout would have. Perfect for:
-
Educational materials
-
Blog posts
-
Social media content
-
Informal team updates
The ability to toggle styles without rebuilding the entire infographic saved considerable time during iterative design rounds.
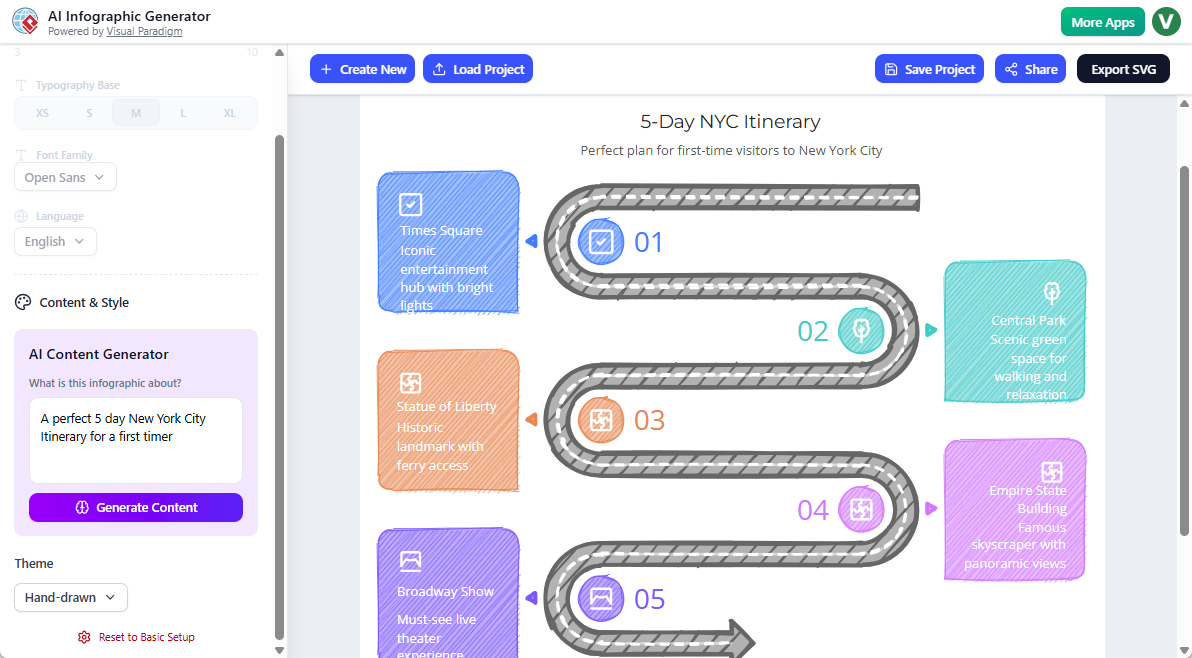
Export & Sharing: Ready for Real-World Use
Final outputs support multiple distribution channels:
-
SVG Export: Vector files that scale from business cards to billboards without quality loss. Essential for print designers or brand teams maintaining asset consistency.
-
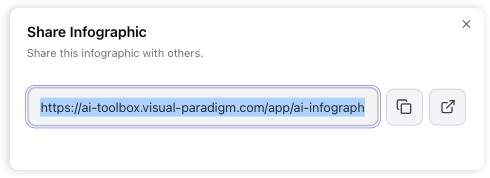
Instant Web Links: Generate a unique URL to share with stakeholders. Recipients view the interactive infographic without downloading files—handy for quick client reviews.
-
High-Resolution PNG/JPG: For social media uploads or embedding in documents.
I tested the SVG export in Adobe Illustrator and confirmed layers remained editable—a detail that matters for professional workflows.
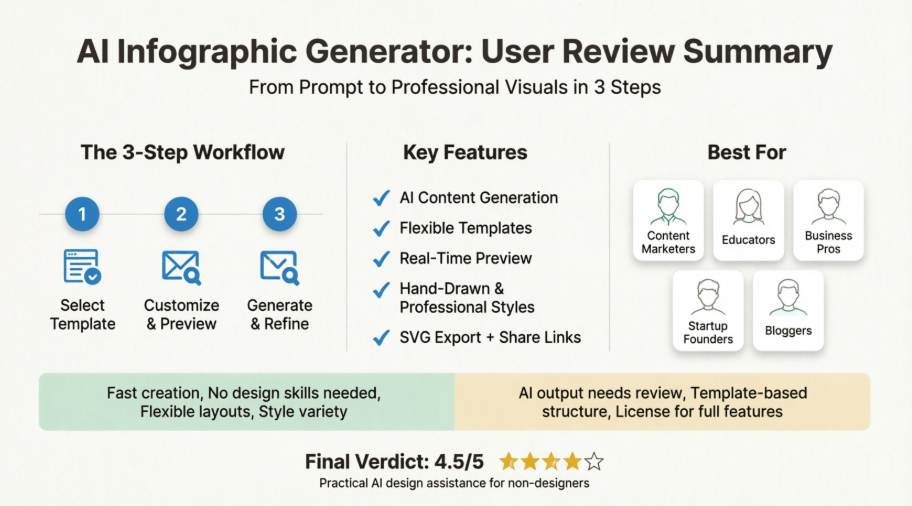
Honest Pros & Cons After Hands-On Testing
✅ What Worked Well
-
No design skills required: The guided workflow genuinely lowers the barrier to creating polished visuals
-
Time savings: From prompt to shareable graphic in under 5 minutes for simple projects
-
Flexible templates: Adding/removing sections doesn’t break layouts—a rare convenience
-
Style variety: Professional and hand-drawn options cover diverse use cases
-
Real-time previews: See changes before committing reduces trial-and-error frustration
⚠️ Considerations to Keep in Mind
-
AI content needs review: Outputs are strong first drafts but require human editing for brand voice or technical accuracy
-
Template dependency: While flexible, you’re still working within predefined structures (not freeform canvas design)
-
Learning curve for advanced tweaks: Basic use is intuitive, but mastering all customization options takes exploration
-
License requirements: Full feature access requires Visual Paradigm Online Combo license or higher
Who Is This Tool Best For?
Based on my testing, Visual Paradigm’s AI Infographic Generator delivers the most value for:
🎯 Content Marketers: Quickly produce social media visuals, blog graphics, or campaign assets without waiting on design teams
🎯 Educators & Trainers: Create engaging lesson materials, workshop handouts, or student resources with approachable hand-drawn styles
🎯 Business Professionals: Turn meeting notes or strategy documents into clear visual summaries for stakeholders
🎯 Startup Founders: Develop pitch deck visuals, roadmap graphics, or investor updates without hiring a designer
🎯 Bloggers & Creators: Enhance articles with custom charts, timelines, or comparison graphics that boost reader engagement
If your workflow demands pixel-perfect brand control or highly custom illustrations, you may still need dedicated design software. But for 80% of everyday visual communication needs? This tool punches above its weight.
Conclusion: A Practical Power-Up for Visual Storytelling
After extensive hands-on testing, Visual Paradigm’s AI Infographic Generator earns a solid recommendation for professionals seeking to bridge the gap between ideas and impactful visuals. It doesn’t replace human creativity or strategic thinking—but it dramatically accelerates the execution phase.
The recent interface overhaul and addition of hand-drawn styles show a team listening to user feedback. The three-step workflow respects users’ time, while the AI content assistance reduces the mental load of starting from scratch. Yes, outputs benefit from human refinement, but that’s true of any AI tool. The real win is turning hours of design work into minutes of guided creation.
For teams balancing quality, speed, and accessibility in visual content creation, this tool offers a compelling middle path between DIY frustration and outsourcing dependency. If you’ve ever stared at a blank canvas wishing for a smarter starting point, it’s worth exploring.
Final Verdict: 4.5/5 stars — A highly practical AI design assistant that delivers on its core promise: helping non-designers create professional infographics, fast.
References
-
Visual Paradigm AI Infographic Generator – Main Tool Page: Direct access to the AI-powered infographic creation application with real-time editing and export capabilities.
-
AI-Powered Infographic Generator Feature Overview: Comprehensive documentation of features including template categories, AI content generation, style options, and sharing functionalities.
-
Visual Paradigm Product Updates & Enhancements: Official announcement detailing the revamped user interface, hand-drawn style support, and streamlined three-step creation workflow introduced in early 2026.