Developers often face the temptation to jump straight into the editor and start typing logic immediately. This approach feels efficient in the short term, but it frequently leads to architectural fragility and significant technical debt over time. Writing software without a clear map of system interactions is akin to constructing a multi-story building without blueprints. You might get the foundation right, but the upper floors will likely collapse under their own weight.
A UML sequence diagram serves as that essential blueprint. It visualizes how different objects or components within a system interact over time. By planning these interactions before a single line of production code is written, you align your team, clarify edge cases, and prevent costly refactoring later. This guide explores the necessity of this practice, breaking down the mechanics, benefits, and implementation strategies.
📐 What is a UML Sequence Diagram?
Unified Modeling Language (UML) sequence diagrams are a specific type of interaction diagram. They describe how objects operate with one another and in what order. Unlike class diagrams that show structure, sequence diagrams show behavior over a timeline.
- Lifelines: Represent the participants in the interaction, such as a User, an API Gateway, or a Database.
- Messages: Arrows indicating data flow or function calls between participants.
- Activation Bars: Rectangles on lifelines showing when an object is actively performing a task.
- Return Messages: Dashed arrows showing the response from a called function back to the caller.
When you create this diagram, you are essentially simulating the execution path of your software logic on paper (or a digital canvas) before committing resources to implementation. This visual representation forces you to confront questions about data flow that are often overlooked during initial brainstorming.
💸 The High Cost of Skipping Visual Planning
Skipping the design phase often results in what developers call “code smell” or architectural debt. When you do not map out the sequence of events, you risk building a system that works in isolation but fails in integration. Consider the following scenarios where the lack of a sequence diagram creates friction:
- Database Schema Changes: You write a function that saves data. Later, you realize another service needs that data, but it was never stored correctly. You must now refactor the database schema and migrate existing data.
- API Versioning Issues: The frontend expects a response in a specific format, but the backend returns it differently because the interaction flow was not agreed upon. This breaks the client application and requires a patch.
- Security Gaps: Without mapping the flow, you might miss a step where authentication tokens are validated. This leaves the system vulnerable to unauthorized access.
- Performance Bottlenecks: You might not realize that a specific sequence triggers three database calls for a single user action, leading to slow page loads.
These issues are not merely inconveniences; they are direct costs. Time spent fixing these problems post-deployment is significantly higher than the time spent planning them upfront.
🤝 Core Benefits for Development Teams
The value of a sequence diagram extends beyond the individual coder. It acts as a communication bridge between different roles within a software organization. Here is how it improves the ecosystem:
- Shared Understanding: Product managers, developers, and testers all look at the same diagram. This eliminates ambiguity regarding what the system should do.
- Early Detection of Logic Errors: It is easier to move a line on a diagram than to rewrite code. If a loop condition looks wrong on the chart, you catch it immediately.
- Test Case Generation: QA engineers can derive test scenarios directly from the interaction paths shown in the diagram. This ensures higher coverage and fewer bugs in production.
- Onboarding Efficiency: New team members can review the diagram to understand the system flow without digging through thousands of lines of code.
When everyone agrees on the interaction model, the coding phase becomes an execution task rather than an exploratory one. This shift in mindset significantly boosts productivity.
🧩 Anatomy of a Robust Sequence Model
To get the most out of this practice, the diagram must be detailed enough to be useful but simple enough to be readable. A robust model includes specific components that define the behavior clearly.
1. Identifying Actors and Systems
Start by listing every entity involved. This includes external systems (like payment gateways or third-party APIs), internal services, and the user interface. Each actor gets a vertical lifeline.
2. Defining the Trigger Event
Every sequence starts with an event. This could be a user clicking a button, a scheduled job running, or an incoming webhook. Clearly marking the trigger sets the context for the entire interaction.
3. Mapping Synchronous vs. Asynchronous Calls
Not all interactions happen in real-time. You must distinguish between:
- Synchronous: The sender waits for a response before continuing. (e.g., API calling a database).
- Asynchronous: The sender continues without waiting. (e.g., Sending an email notification).
Confusing these two can lead to race conditions or timeouts in the actual code. The diagram clarifies which calls require blocking behavior and which do not.
4. Handling Failure Paths
Most diagrams focus on the happy path. However, a complete sequence diagram must also show what happens when things go wrong. Include notes for:
- Network timeouts.
- Database connection failures.
- Invalid user input.
- Authentication rejections.
If the code does not account for these failures, the system will crash. The diagram ensures you have error handling logic mapped out.
🛠️ Step-by-Step Construction Guide
Creating a sequence diagram does not require complex tools or extensive training. Follow this structured approach to build a reliable model.
- Define the Scope: Decide which feature or module you are designing. Do not attempt to diagram the entire application at once.
- List the Participants: Write down every service, database, and client involved.
- Draw the Lifelines: Arrange them horizontally. Place the initiator on the far left.
- Map the Happy Path: Draw the primary flow of events from start to finish.
- Add Alternative Flows: Draw branches for errors, retries, or different user choices.
- Review and Refine: Walk through the diagram with a colleague. Ask if every step is necessary and logical.
This process ensures that the design is not just a personal exercise but a validated artifact.
⚠️ Common Mistakes to Avoid
Even experienced architects make errors when creating these diagrams. Be aware of the following pitfalls to maintain quality.
- Over-Engineering: Trying to diagram every single micro-function. Focus on the high-level interactions first.
- Ignoring State: Failing to show that data changes state between steps. This can lead to logic errors where a variable is used before it is initialized.
- Too Many Actors: If a diagram has more than ten lifelines, it becomes unreadable. Split complex flows into smaller, modular diagrams.
- Static vs. Dynamic: Do not confuse a sequence diagram with a class diagram. The former is about time and flow; the latter is about structure.
- Ignoring Timeouts: Failing to note how long a process should take before timing out.
🏃♂️ Integrating Design into Agile Sprints
Agile methodologies emphasize speed and iteration. Some teams worry that diagramming slows them down. However, when done correctly, it accelerates delivery by reducing rework.
- Just-in-Time Modeling: Create the diagram during the sprint planning phase, not weeks before.
- Living Documentation: Treat the diagram as a living document. Update it as the code changes.
- Lightweight Tools: Use tools that allow for quick updates without heavy overhead.
- Code Reviews: Include the sequence diagram in pull requests. Reviewers can check if the implementation matches the design.
This integration ensures that documentation remains relevant and that the design evolves with the product.
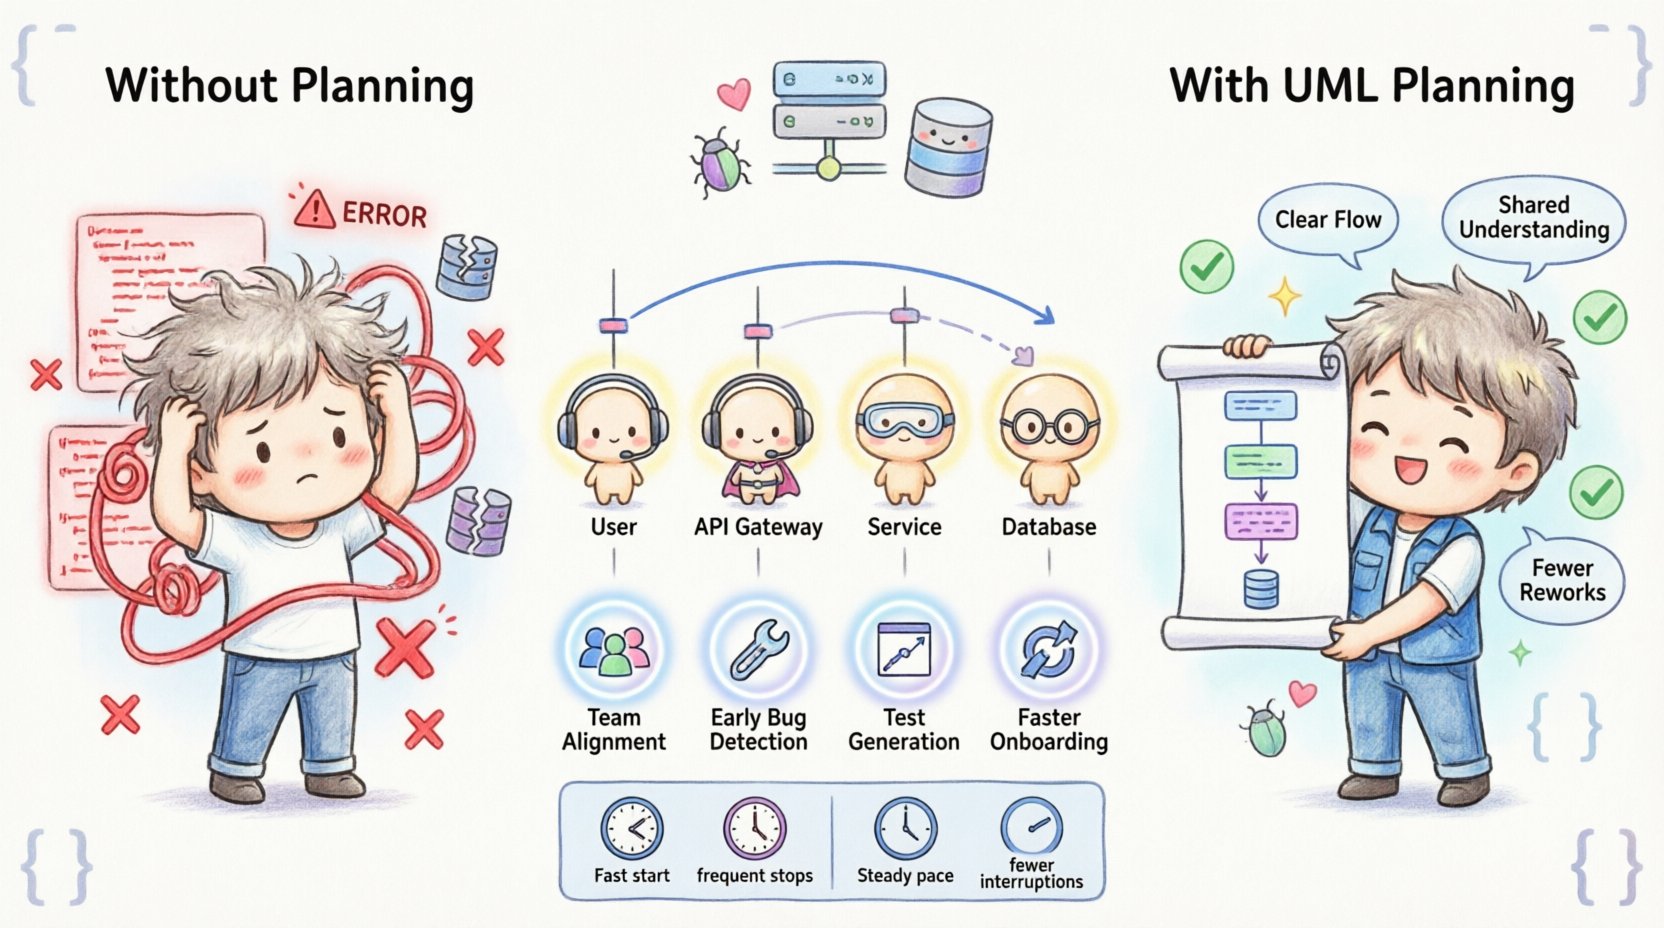
📊 Comparison: With vs. Without Diagrams
To illustrate the impact, consider the following comparison of development workflows.
| Feature | Without Sequence Diagram | With Sequence Diagram |
|---|---|---|
| Time to Code | Fast start, frequent stops | Steady pace, fewer interruptions |
| Refactoring Rate | High (logic changes often) | Low (logic is pre-validated) |
| Bug Discovery | During QA or Production | During Design Review |
| Team Alignment | Varies by individual understanding | Unified visual reference |
| Edge Case Coverage | Often overlooked | Explicitly planned |
The data suggests that while the upfront time investment exists, the total time to a stable release is often lower when using visual planning.
📈 Measuring the Impact on Delivery Speed
How do you know if this practice is working for your team? Look for specific metrics over time.
- Change Request Frequency: Are product requirements changing often after development starts? A good design reduces this.
- Defect Density: Are there fewer bugs reported in the production environment?
- Onboarding Time: Does it take less time for new developers to understand the codebase?
- Refactoring Effort: Is the effort spent fixing architectural issues decreasing?
Tracking these metrics helps you justify the practice to stakeholders and refine the process further.
🛠️ Tools vs. Thinking
It is important to remember that the tool is secondary to the thinking. Whether you use pen and paper, a whiteboard, or software, the value lies in the clarity of thought.
- Pen and Paper: Fastest for brainstorming. Great for quick sketches.
- Whiteboard: Excellent for collaborative sessions with the team.
- Digital Tools: Better for version control and long-term storage.
Do not get bogged down in selecting the perfect software. The goal is to communicate the logic, not to create a perfect graphic. If the diagram helps you write better code, it has succeeded.
🚫 Avoiding the “Documentation Trap”
There is a risk of creating documentation that no one reads. To avoid this:
- Keep it Simple: Use standard notation that everyone understands.
- Keep it Updated: If the code changes and the diagram does not, delete the diagram.
- Focus on Critical Flows: Do not diagram every single method. Focus on the critical paths that affect the system integrity.
- Integrate with Workflow: Make the diagram a required part of the definition of done.
By keeping the documentation lean and relevant, you ensure it remains a valuable asset rather than a burden.
🔍 Deep Dive: Handling Concurrency
One of the most difficult aspects of software design is concurrency. Multiple users accessing the same resource simultaneously can lead to data corruption. A sequence diagram helps visualize this.
- Locking Mechanisms: Show where locks are acquired and released.
- Transaction Boundaries: Indicate where a transaction starts and ends.
- Queueing: Show how requests are queued if the system is under load.
By visualizing these interactions, you can identify potential race conditions before they manifest in the code. This is a critical step for high-traffic systems.
🔍 Deep Dive: API Contract Verification
When integrating with external APIs, the sequence diagram acts as a contract verification tool. It defines the exact request and response structure.
- Request Payload: What data is sent?
- Response Schema: What data is received?
- Error Codes: What codes are returned for failures?
This clarity prevents integration failures where the client and server speak different languages. It ensures that the data contract is agreed upon before implementation begins.
🔍 Deep Dive: Security Considerations
Security is often an afterthought in development. A sequence diagram forces you to consider it during the design phase.
- Authentication Points: Where is the user logged in?
- Authorization Checks: Where is access verified?
- Data Encryption: Where is data encrypted in transit or at rest?
By marking these points on the diagram, you ensure that security controls are embedded into the flow, not bolted on later.
🔍 Deep Dive: Performance Optimization
Performance bottlenecks often arise from inefficient interaction patterns. The diagram allows you to spot these early.
- N+1 Queries: Identify loops that trigger multiple database calls.
- Blocking Operations: Find sections where the UI waits for slow backend processes.
- Caching Opportunities: Spot where data could be cached to reduce load.
Optimizing the design is much cheaper than optimizing the production code. The sequence diagram provides the visibility needed to make these decisions.
🔍 Deep Dive: Legacy System Integration
Integrating new features with legacy systems is complex. Old systems often have undocumented behaviors. A sequence diagram helps bridge this gap.
- Mapping Old Interfaces: Visualize how the new system talks to the old one.
- Identifying Fragile Parts: Highlight areas where changes are risky.
- Decoupling: Plan for an abstraction layer to separate new code from old dependencies.
This approach minimizes the risk of breaking existing functionality while modernizing the stack.
🔍 Deep Dive: Testing Strategy Alignment
Testing strategies should align with the design. The sequence diagram informs the test plan.
- Unit Tests: Test individual methods shown in the activation bars.
- Integration Tests: Test the interactions between lifelines.
- End-to-End Tests: Validate the entire flow from trigger to completion.
This alignment ensures that tests cover the actual user journey, not just isolated code snippets.
Final Thoughts on Design Discipline
Adopting the practice of drawing UML sequence diagrams before coding requires discipline. It demands that you slow down to speed up. In a market that values speed, this counter-intuitive approach can be the differentiator between a fragile product and a robust platform.
By investing time in visual planning, you reduce the cognitive load on your team. You create a shared language that transcends individual coding styles. You build a system that is easier to maintain, scale, and secure.
The code is a means to an end. The design is the blueprint for that end. Prioritize the blueprint, and the building will stand tall.