Software development is fundamentally about communication. It is not merely writing code; it is defining how components interact, how data flows, and how systems behave over time. For new developers stepping into complex architectures, visualizing these interactions is critical. One of the most powerful tools in this arsenal is the UML Sequence Diagram.
This guide provides a comprehensive look at sequence diagrams. We will explore their structure, their syntax, and how they serve as a blueprint for system logic. By understanding these diagrams, you gain clarity on the temporal order of operations, making your code more maintainable and your architecture more robust.
🧩 What is a UML Sequence Diagram?
A Unified Modeling Language (UML) sequence diagram is a type of interaction diagram. It shows how objects or processes interact with each other over time. Unlike a class diagram, which focuses on structure, a sequence diagram focuses on behavior and timing.
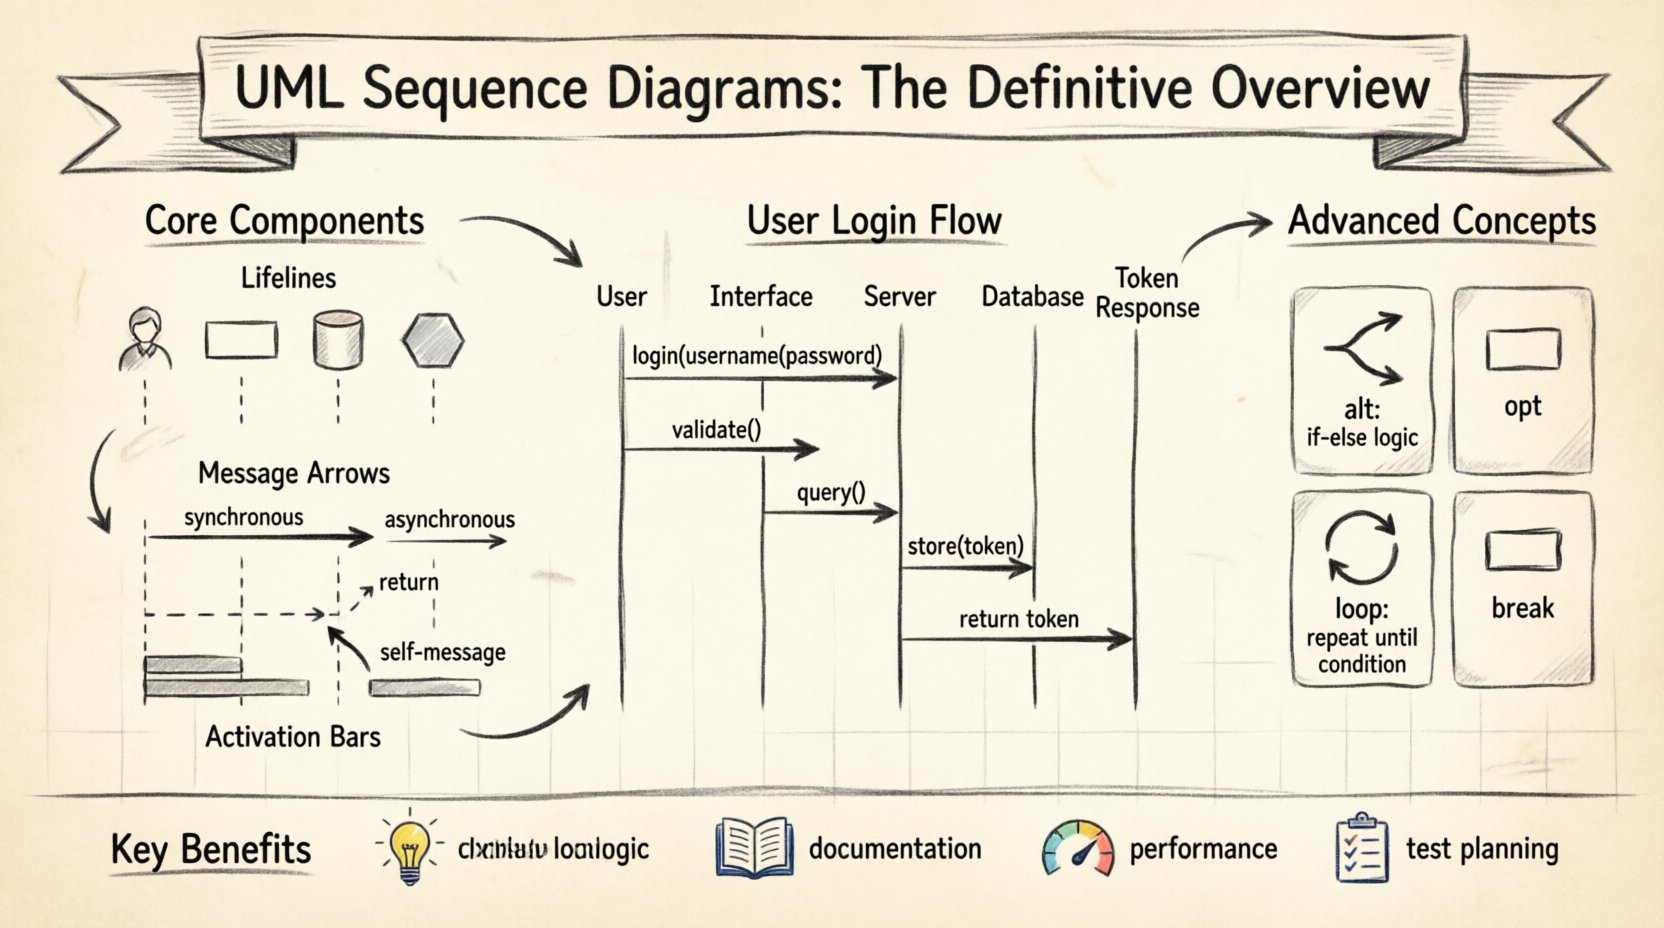
Imagine a scenario where a user logs into a banking application. A sequence diagram maps out the exact steps:
- The user enters credentials.
- The interface sends data to the server.
- The server validates the user.
- The database retrieves account details.
- The server returns a success token.
Each of these steps becomes a message flowing between entities. This visualization helps developers spot logical gaps before writing a single line of code.
🏗️ Core Components of a Sequence Diagram
To read or create a sequence diagram effectively, you must understand its building blocks. Every diagram relies on a consistent set of symbols. Below is a breakdown of the essential elements.
1. Lifelines
A lifeline represents a participant in the interaction. This could be a user, a system, a database, or a specific software module. In the diagram, a lifeline is depicted as a vertical dashed line extending from the top to the bottom.
- Actor: Usually represented by a stick figure icon at the top. This is often a human user or an external system.
- Object/Class: Represented by a rectangle with the name of the object or class. The line extends downward from this box.
- Boundary: Represents the interface between the system and the outside world.
- Control: Represents the logic or process handling the interaction.
- Entity: Represents data or persistent information.
2. Messages
Messages are the horizontal arrows connecting lifelines. They represent the communication between participants. The type of arrow indicates the nature of the communication.
| Arrow Type | Symbol | Meaning |
|---|---|---|
| Synchronous Message | 🠖 (Solid line, filled arrowhead) | The sender waits for the receiver to complete the action before proceeding. |
| Asynchronous Message | ➡️ (Solid line, open arrowhead) | The sender sends the message and continues without waiting for a response. |
| Return Message | ↱ (Dashed line, open arrowhead) | Indicates a response or return value sent back to the caller. |
| Self-Message | ↻ (Curved arrow on same lifeline) | An object calls a method on itself. |
3. Activation Bars
Also known as execution occurrences, these are the thin rectangles placed on a lifeline. They indicate the period during which an object is performing an action or is actively involved in the interaction.
- If a lifeline has an activation bar, it means the object is currently processing a request.
- The bar starts when a message arrives and ends when the response is sent or the operation completes.
- Long activation bars suggest heavy processing, while short ones indicate quick lookups or simple returns.
4. Focus of Control
This is essentially the same as the activation bar. It highlights the active period of a lifeline. When a message is received, the focus moves to that lifeline. When it sends a response, the focus may return to the original caller.
📝 Syntax and Notation Rules
Consistency is key when documenting software architecture. Deviating from standard notation can confuse stakeholders. Follow these rules to ensure clarity.
- Left to Right: Interactions generally flow from left to right across the diagram. The initiating actor is usually on the far left.
- Top to Bottom: Time flows downwards. The first message is at the top, and the final response is at the bottom.
- Labeling: Every message should be labeled with the operation name or event it represents.
- Parameters: If a message requires data, include it in parentheses. Example:
login(username, password). - Return Values: Return messages often include the data being returned. Example:
200 OKoruser_data.
🚀 Creating a Sequence Diagram: A Step-by-Step Guide
Building a diagram requires a structured approach. Rushing into drawing without a plan often leads to cluttered and confusing visuals. Follow this workflow to create effective diagrams.
Step 1: Define the Scope
Before drawing, identify what interaction you are modeling. Is it a full login process? Is it a specific API endpoint? Is it a background job? Narrowing the scope prevents the diagram from becoming overwhelming.
Step 2: Identify Participants
List all the actors and system components involved. You do not need to include every single class. Focus on the high-level components that drive the flow. Too many participants make the diagram hard to read.
Step 3: Map the Primary Flow
Start with the happy path. Draw the messages that occur when everything works correctly. This establishes the baseline logic. Use synchronous messages for critical steps where one action depends on the completion of another.
Step 4: Add Alternative Flows
What happens if an error occurs? What if the user cancels the action? Use frames to denote these alternatives. This is where the diagram becomes truly valuable for understanding edge cases.
Step 5: Review and Refine
Walk through the diagram logically. Does the timing make sense? Are the return messages balanced with the requests? Ensure that no lifeline is left hanging with an activation bar that never ends.
🧠 Advanced Concepts
Basic diagrams cover standard interactions, but real-world systems require more complex modeling. Here are advanced concepts you should master.
1. Combined Fragments
Combined fragments allow you to group messages and define specific logic for how they execute. They are enclosed in a rectangular box with a label in the top left corner.
- alt (Alternative): Represents if-else logic. Only one of the enclosed blocks will execute based on a condition.
- opt (Option): Represents optional logic. The enclosed block may or may not execute.
- loop: Represents iteration. The enclosed messages repeat while a condition is true.
- break: Represents an exit condition within a loop.
- par (Parallel): Represents concurrent processes. Messages inside execute simultaneously.
2. Delegation
Delegation occurs when one object forwards a request to another. This is common in layered architectures where a controller passes data to a service, which then talks to a repository. It keeps the diagram clean by hiding internal complexity.
3. Message Ordering
In complex systems, messages may arrive out of order or be processed asynchronously. While sequence diagrams show logical order, they do not always guarantee physical timing. Use notes to clarify timing constraints if necessary.
🛠️ Common Mistakes to Avoid
Even experienced developers make errors when designing diagrams. Being aware of these pitfalls will save you time during code reviews and documentation updates.
- Too Much Detail: Do not include every method call. If a component has 50 methods, only show the ones relevant to the current interaction. High-level abstraction is better than low-level noise.
- Inconsistent Naming: Ensure object names in the diagram match the code. If the diagram says
UserService, the code should reflect that. - Missing Return Messages: Every request should ideally have a return message, even if it is just an acknowledgment. This confirms the flow is complete.
- Crossing Arrows: Try to arrange lifelines so that message arrows do not cross. Crossing lines create visual noise and make tracing the path difficult.
- Ignoring Time: A sequence diagram is about time. If step B happens before step A in reality, but you draw A before B, the diagram is incorrect.
📊 Benefits of Using Sequence Diagrams
Why invest time in creating these diagrams? The return on investment is significant for software quality and team alignment.
- Clarifies Logic: It forces you to think through the flow before coding. This reduces the likelihood of logical bugs.
- Facilitates Communication: It is easier to discuss a diagram with a product manager than a thousand lines of code. Non-technical stakeholders can understand the flow.
- Documentation: It serves as living documentation. When a new developer joins, a sequence diagram explains the system behavior instantly.
- Identifies Bottlenecks: By looking at activation bars, you can see which components are doing heavy lifting. This helps in performance optimization.
- Test Planning: Test cases can be derived directly from the messages and paths shown in the diagram.
🔄 Integration with Development Workflow
Sequence diagrams are not static artifacts. They should evolve with the codebase. Here is how to integrate them into your development cycle.
1. Design Phase
Start the project with high-level sequence diagrams. Define the core interactions between the front end, back end, and external services. This sets the contract for development.
2. Code Implementation
As you write code, refer to the diagram. If the code diverges from the diagram, update the diagram. Do not let the diagram become outdated.
3. Code Review
Include references to sequence diagrams in pull requests. Reviewers can check if the implementation matches the designed interaction flow. This catches architectural drift early.
4. Maintenance
When refactoring, update the diagram. If you change a method signature, update the message label. Keeping the diagram in sync ensures it remains a useful tool.
🧐 Analyzing a Diagram for Performance
Sequence diagrams can also be used for performance analysis. Look for patterns that indicate inefficiency.
- N+1 Query Problems: If you see a loop where the same type of message is sent repeatedly to a database, you might have a performance issue.
- Blocking Calls: If a main thread waits on many synchronous messages in a row, the system may feel slow to the user. Consider making some calls asynchronous.
- Long Activation Bars: Long bars indicate heavy processing. Consider offloading this work to background jobs.
- Excessive Chaining: If a message passes through five layers before reaching the database, you may have too much abstraction. Simplify the architecture.
📚 Summary of Key Takeaways
To summarize the essential points for mastering this visualization technique:
- Purpose: Sequence diagrams map interactions over time.
- Components: Lifelines, messages, and activation bars are the core elements.
- Notation: Use standard arrows for synchronous and asynchronous calls.
- Frames: Use
alt,loop, andoptfor complex logic. - Clarity: Avoid crossing lines and keep labels consistent.
- Integration: Update diagrams as the code evolves.
🤝 Final Thoughts
Creating UML sequence diagrams is a discipline that pays dividends in software stability and team cohesion. It shifts the focus from how to write code to what the code should do and when it should do it. For new developers, adopting this practice early builds a foundation for better system design.
Remember, the goal is not perfection in the drawing, but clarity in the understanding. Use these diagrams to facilitate discussion, validate logic, and document your architecture. As your systems grow in complexity, these visual tools will remain essential for keeping the codebase understandable and maintainable.
Start with simple interactions. Draw the flow of a single request. Gradually expand to full system workflows. With practice, you will find that visualizing your system becomes as natural as writing the code itself.