Understanding how different components of a software system work together is a critical skill for any developer or architect. While class diagrams show static structure, they do not show behavior over time. This is where the UML sequence diagram comes into play. It visualizes interactions between objects in the chronological order of events. Many beginners find the notation confusing or struggle to know when to use it. This guide answers the most frequently asked questions to help you build clear, effective diagrams.
📐 What is a UML Sequence Diagram?
A sequence diagram is a type of interaction diagram in the Unified Modeling Language (UML). Its primary purpose is to show how operations are carried out, what messages are sent and received, and in what order. It emphasizes the time sequence of these messages.
- Focus: It focuses on the flow of control and data between objects.
- Orientation: Time flows vertically from top to bottom.
- Participants: It involves objects, actors, and subsystems interacting via messages.
Think of it as a script for a play. The actors are the participants, and the lines of dialogue are the messages passed between them. This visual aid helps teams align on logic before writing a single line of code.
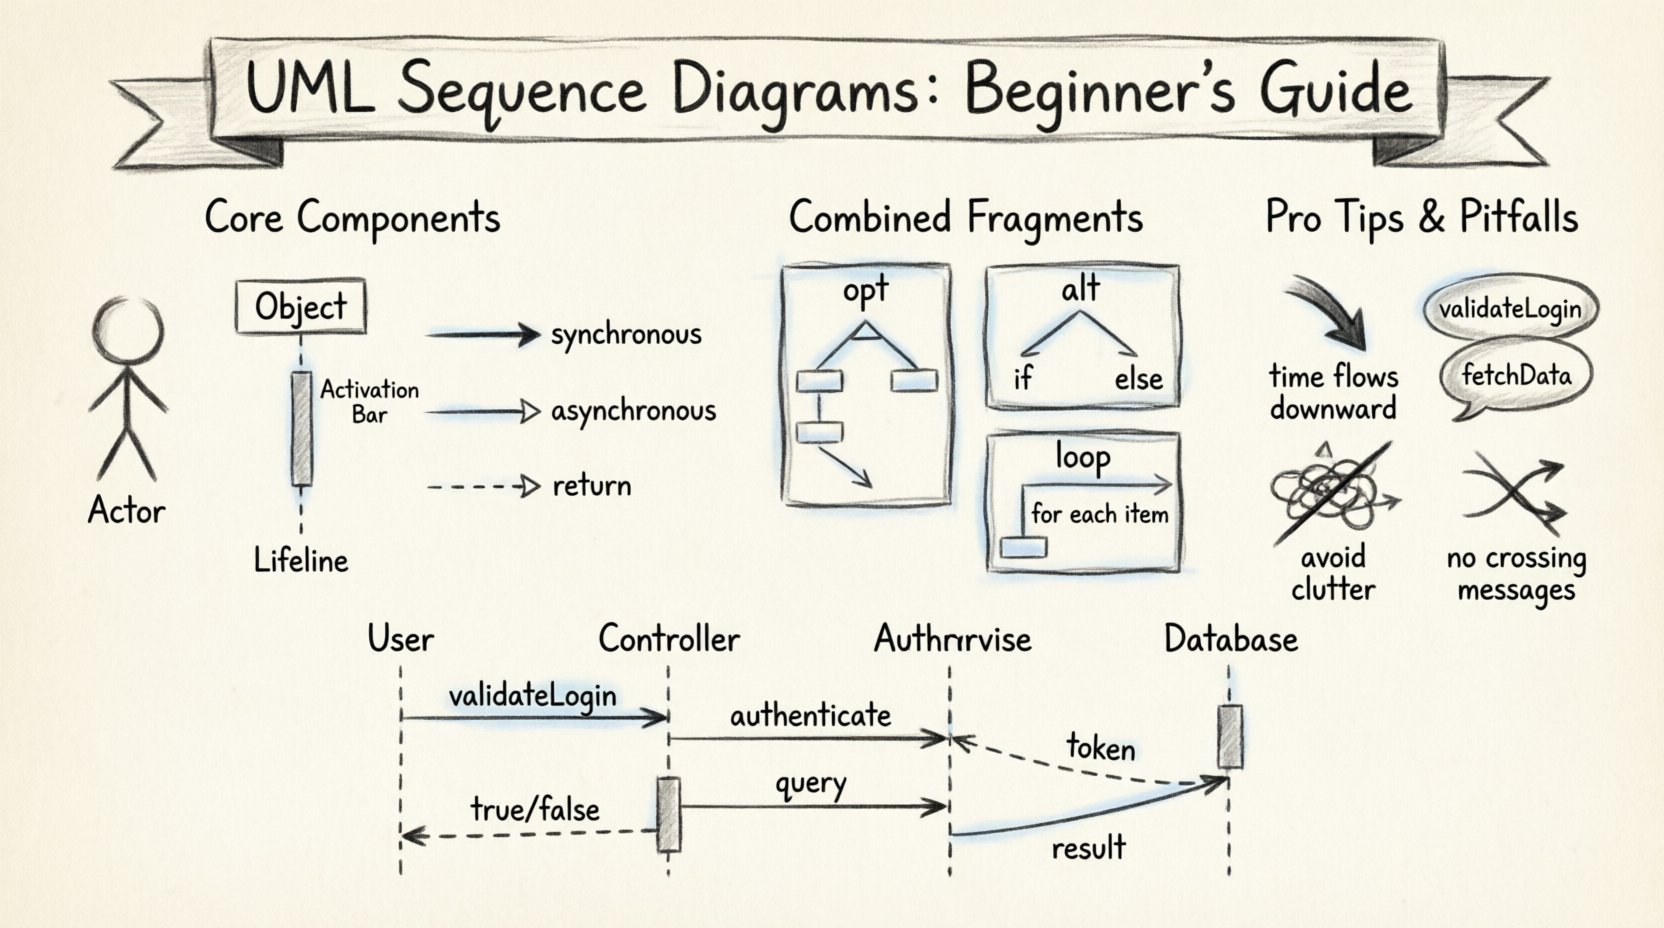
🧩 What are the Core Components?
Before drawing, you must understand the building blocks. A diagram without clear components leads to confusion.
1. Participants (Lifelines)
A participant represents an object or a role in the system. It is depicted as a rectangle with the name of the object or class at the top. A dashed line extends downwards from this rectangle. This line is called a lifeline.
- Actors: Represent human users or external systems. They are drawn as stick figures.
- Objects: Represent specific instances of a class. They are drawn as rectangles.
- System Boundary: Sometimes a box is drawn to enclose the system being modeled, separating internal objects from external actors.
2. Messages
Messages represent communication between participants. They are drawn as arrows connecting lifelines.
- Synchronous: A solid line with a filled arrowhead. The sender waits for a response before continuing.
- Asynchronous: A solid line with an open arrowhead. The sender does not wait for a response.
- Return: A dashed line with an open arrowhead. It indicates the return value from the previous call.
3. Activation Bars
Also known as focus of control, this is a thin rectangle placed on the lifeline. It indicates the period during which an object is performing an action or waiting for a response. If the bar is visible, the object is active.
4. Combined Fragments
These boxes frame specific parts of the interaction to add logic like loops or conditions. They are labeled with keywords like opt, alt, or loop.
❓ Common Beginner Questions Answered
Here are the specific questions that often trip up newcomers to diagramming.
Q1: How do I know when to draw a message?
You draw a message whenever one object triggers an action in another. If Object A calls a method on Object B, draw an arrow from A to B. If Object B needs to call a database to retrieve data, draw an arrow from B to the Database object.
- Do not draw every internal method call within a single object unless it is critical to the flow.
- Focus on the boundary crossings between objects.
- Ensure the sequence makes logical sense.
Q2: What is the difference between alt and opt frames?
Both represent conditional logic, but they serve different purposes.
| Keyword | Meaning | Scenario Example |
|---|---|---|
opt |
Optional | The user has a choice to log in with social media. It may or may not happen. |
alt |
Alternative | If the password is correct, login succeeds. Otherwise, show an error. One must happen. |
Use alt when you have mutually exclusive paths. Use opt when a step is optional and might be skipped entirely.
Q3: How should I represent a loop?
Loops are common when processing lists or iterating through items. Use the loop frame. Inside the frame, you place the messages that repeat.
- Standard Loop: Use a frame labeled
loop. - Iteration Count: You can specify
for each itemorwhile conditioninside the frame header. - Visuals: Do not draw the message 10 times. Draw it once inside the frame to indicate repetition.
Q4: When should I create an object?
Objects are created dynamically in many systems. In a sequence diagram, you show this with a message that has a specific stereotype like <<create>>.
- The arrow points to the new object.
- The new object’s lifeline starts at the point of creation, not at the top of the diagram.
- This clarifies the lifecycle of the object within the specific interaction.
Q5: How do I show object destruction?
When an object is no longer needed, it can be destroyed. This is shown with an X at the bottom of the lifeline.
- The
Xindicates the object ceases to exist. - This is useful for showing temporary objects or clearing resources.
- Ensure the destruction happens after all necessary messages are sent.
🛠️ Detailed Notation Guide
To ensure your diagrams are readable by anyone on the team, consistency in notation is key. Below is a reference for the most common symbols.
| Symbol | Visual Description | Usage |
|---|---|---|
| Arrow (Solid) | → (Filled Head) | Synchronous Call (Wait for response) |
| Arrow (Solid) | → (Open Head) | Asynchronous Call (Fire and forget) |
| Arrow (Dashed) | – – – → (Open Head) | Return Message / Response |
| Rectangle | ▬▬▬ | Activation Bar (Focus of Control) |
| Box | ┌────┐ | Combined Fragment (Alt, Opt, Loop) |
| Line | │ | Lifeline (Time of existence) |
⚠️ Common Mistakes to Avoid
Even experienced practitioners can make errors that reduce clarity. Watch out for these frequent pitfalls.
- Too much detail: Do not draw every single getter and setter. Focus on the business logic flow. If a diagram is cluttered, simplify it.
- Horizontal overlap: Avoid messages that cross over each other too much. If you have many participants, try to arrange them logically (e.g., Controller on left, Model on right, Database on far right).
- Missing return messages: If you draw a call, you should generally show the return, even if it is just a null response. This completes the transaction visually.
- Ignoring timing: If the order of events matters, ensure the vertical position reflects the time sequence accurately.
- Using text boxes for logic: Do not write paragraphs inside the diagram. Use the
refframe to reference another sequence diagram for complex logic.
📝 Best Practices for Clean Diagrams
A good diagram is self-explanatory. Follow these guidelines to improve readability.
1. Naming Conventions
Use meaningful names for objects and messages.
- Objects: Use lowercase with underscores (e.g.,
user_sessionorOrderService). - Messages: Use verb phrases (e.g.,
validateLogin,fetchData).
2. Abstraction Levels
Keep the level of abstraction consistent. Do not mix high-level business steps with low-level database queries in the same diagram unless necessary.
- High Level: Focus on user interaction and main service calls.
- Low Level: Focus on data retrieval and validation logic.
3. Use Frames for Complexity
If a diagram becomes too long, break it down.
- Use a
ref(Reference) frame to point to a separate diagram for a sub-process. - This keeps the main flow readable while allowing deep dives where needed.
4. Consistency in Style
Ensure all team members use the same line thickness, font sizes, and arrow styles. Standardization reduces cognitive load when reviewing designs.
🔄 Synchronous vs. Asynchronous Messages
Distinguishing between these two is vital for understanding system performance and blocking behavior.
Synchronous Calls
These are blocking operations. The sender pauses execution until the receiver finishes the task and returns a result.
- Visual: Solid line, filled arrowhead.
- Use Case: User waiting for a page to load, API request waiting for a response.
- Implication: High coupling between sender and receiver.
Asynchronous Calls
These are non-blocking. The sender sends the message and continues with other tasks immediately.
- Visual: Solid line, open arrowhead.
- Use Case: Sending an email notification, logging an event, background job processing.
- Implication: Lower coupling, better for system scalability.
🧪 Example Scenario: User Login
Let us walk through a simple example to tie everything together. Imagine a user logging into a system.
- Actor (User) sends a
loginRequestto Controller. - Controller activates and sends
validateCredentialsto AuthService. - AuthService activates and sends
findUserto Database. - Database returns
userDatato AuthService. - AuthService validates and returns
successto Controller. - Controller returns
dashboardPageto Actor.
In this flow:
- Activation bars would appear on Controller, AuthService, and Database during their respective tasks.
- Return messages are dashed lines.
- The sequence flows strictly from top to bottom.
🚫 When Not to Use a Sequence Diagram
While powerful, these diagrams are not a silver bullet. Avoid them in these scenarios:
- Static Structure: If you only need to show class relationships, use a Class Diagram.
- State Changes: If you need to show how an object changes state based on events, use a State Machine Diagram.
- Simple Flows: For very simple scripts, a flowchart or pseudocode might be clearer.
- Complex Algorithms: Sequence diagrams are not designed to show detailed algorithmic logic inside a single function.
🎯 Summary of Key Takeaways
Building effective UML sequence diagrams requires practice and attention to detail. By adhering to standard notation, you ensure your diagrams communicate clearly across your team.
- Time is vertical: Top is start, bottom is end.
- Messages are arrows: Distinguish between synchronous and asynchronous.
- Frames add logic: Use
alt,opt, andloopfor conditions. - Keep it clean: Avoid clutter and use abstraction frames for complexity.
- Focus on interaction: Show how objects talk, not just how they are built.
Mastering this visual language improves collaboration and reduces misunderstandings during the development lifecycle. Start with simple flows and gradually add complexity as your diagrams mature. Always prioritize clarity over completeness.