Introduction to Mind Maps: The Architecture of Thought
A mind map is more than just a colorful diagram; it is a sophisticated visualization technique that mirrors the cognitive architecture of the human brain. Invented in the 1970s by psychologist Tony Buzan, mind mapping rejects traditional linear note-taking in favor of a radial, non-linear approach. By starting with a central concept and branching outward into related subtopics, this method leverages the brain’s natural inclination for association, utilizing spatial organization, keywords, and visual cues to enhance memory retention and analytical clarity.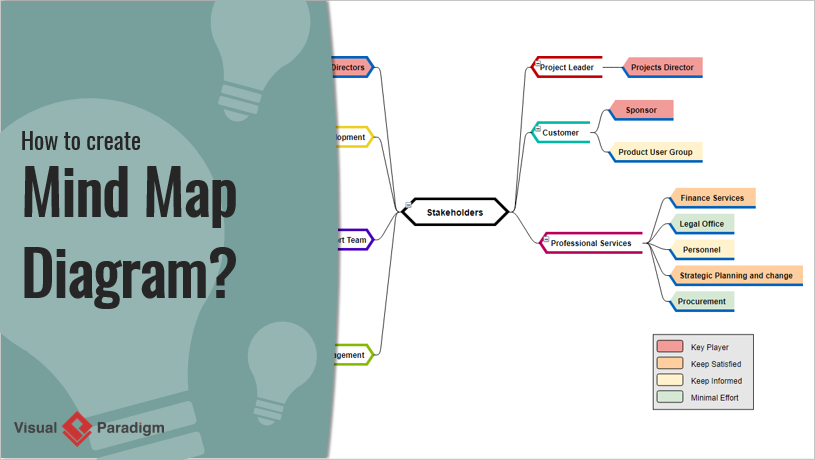
The utility of mind maps spans across industries and disciplines. In education, they summarize complex lectures; in business, they facilitate strategic planning; and in creative fields, they act as engines for uninhibited brainstorming. The core philosophy remains consistent: visualization unlocks potential that linear lists often obscure.
Core Benefits and Applications
Mind maps serve as a bridge between chaotic abstract thoughts and structured execution. Their primary purpose is to facilitate the organization and synthesis of information. Key applications include:
- Brainstorming and Innovation: Capturing spontaneous ideas without the constraints of rigid structure, making it ideal for problem-solving sessions.
- Project Management: Outlining business plans, strategies, or workflows to visualize dependencies and goals.
- Cognitive Recall: Using spatial arrangement and visual elements to improve long-term memory and comprehension of complex subjects.
- Decision Analysis: Mapping out pros, cons, and risks to visualize the potential outcomes of critical choices.
The Mind Mapping Workflow: From Concept to Canvas
Whether executed manually on paper or digitally through software, the creation of a high-quality mind map follows a specific logical progression.
1. Establishing the Core
Every mind map begins with a central idea. This is the anchor of the diagram, placed in the center of the canvas. It represents the primary subject—such as “Product Launch” or “History of Rome”—and is often accompanied by a central image to stimulate visual association.
2. Developing Primary Branches
Radiating from the center are the main branches. These represent the high-level categories or themes directly related to the core topic. Best practices suggest limiting these to 4–7 branches to maintain readability. For example, a mind map on “Vacation Planning” might branch into “Budget,” “Destination,” “Logistics,” and “Activities.”
3. Expanding Hierarchy
The power of a mind map lies in its depth. Each main branch extends into sub-branches containing specific details, examples, or supporting data. This hierarchical expansion transforms a simple concept into a detailed web of knowledge.
4. Visual Enhancement and Connection
To maximize effectiveness, mind maps incorporate icons, varying line thicknesses, and color coding (e.g., green for financial data, blue for logistics). Cross-links are drawn between different branches to highlight relationships and dependencies, revealing the interconnectivity of the system.
Leveraging Artificial Intelligence: Visual Paradigm’s Mind Map Tool
While manual mapping is effective, modern demands for speed and collaboration have paved the way for AI-driven solutions. Visual Paradigm (VP) offers a robust AI Mind Map generator that significantly elevates the standard workflow.
Visual Paradigm distinguishes itself by integrating Natural Language Processing (NLP) to convert simple text prompts into professional, structured diagrams. This automation assists in:
- Rapid Ideation: Users can input a prompt like “Create a mind map for a marketing strategy,” and the AI generates a logically structured tree, saving hours of brainstorming time.
- Intelligent Structuring: The AI applies domain-specific knowledge to suggest relevant branches and subtopics, ensuring that critical elements are not overlooked.
- Seamless Digitization: The output is not static; it renders as an editable diagram that can be refined, styled, and exported to formats like PDF, images, or JSON.
Technical Case Study: “Starting a Small Business” via JSON
To understand the technical superiority of Visual Paradigm’s approach, we can analyze the underlying data structure of an AI-generated map. In this case study, a user prompts the AI to generate a plan for “Starting a Small Business.” VP generates a response in a specific JSON format known as a node_tree.
Understanding the JSON Structure
The JSON output serves as a blueprint for the visual diagram. It is structured to ensure programmatic accessibility and logical hierarchy.
- Meta Data: The file includes fields for the map title, author (AI Assistant), and versioning. This ensures traceability and compatibility with version control systems.
- Root Node: The entry point of the data is the Root Node (ID: “root”), labeled “Starting a Small Business.” This corresponds to the central idea on the canvas.
- Child Nodes: The root node contains an array of children—sub-nodes with unique IDs. In this example, the AI generated 10 distinct branches covering the business lifecycle, such as “Business Idea & Market Research,” “Funding,” and “Risk Management.”

This structured data model allows users to move beyond simple drawing. A developer could parse this JSON to automatically generate project tasks in a separate management tool, or an analyst could import it into Excel for financial modeling. The comprehensive nature of the generated nodes—covering everything from legal compliance to go-to-market strategies—demonstrates how VP’s AI reduces the risk of planning gaps.
Comparative Analysis: Visual Paradigm vs. General LLMs
It is common to question why one should use a specialized tool like Visual Paradigm over a general Large Language Model (LLM) like ChatGPT. The distinction lies in the output quality and usability.
| Feature | Visual Paradigm AI Mind Map | General LLM (e.g., ChatGPT) |
|---|---|---|
| Output Format | Rendered, interactive visual diagram; Exportable JSON/PDF. | Text descriptions, Markdown lists, or ASCII art. |
| Structural Integrity | Validates hierarchy and balance; prevents “hallucinated” branches. | Prone to formatting errors; often lacks visual depth. |
| Workflow Integration | Integrates with BPMN, Agile boards, and Project Management tools. | Isolated text output requiring manual transfer. |
| Usability | Drag-and-drop editing, theming, and real-time collaboration. | Requires manual reformatting to become visually useful. |
Implementation Checklist
Use the following checklist to audit your mind mapping process or to implement Visual Paradigm’s AI solution effectively.
- Define the Objective: Clearly state the central question or project goal (e.g., “Launch Coffee Shop”).
- Select the Tool: Choose a specialized diagramming tool like Visual Paradigm over generic text generators.
- Generate Initial Structure: Use AI prompts to create the baseline hierarchy (Main branches).
- Audit the Hierarchy: Review the AI-generated branches. Are there 4-7 main categories? Is the depth sufficient?
- Customize Visuals: Apply color coding to related branches and insert icons for visual recall.
- Establish Connections: Draw cross-links between dependencies (e.g., linking “Budget” to “Marketing Spend”).
- Export and Integrate: Export the map as JSON for technical integration or PDF for stakeholder presentation.
By combining the cognitive benefits of traditional mind mapping with the speed and structural integrity of Artificial Intelligence, professionals can transform abstract ideas into actionable, comprehensive plans with unprecedented efficiency.