In complex systems engineering, understanding the behavior of a system is just as critical as defining its structure. SysML activity diagrams serve as the primary mechanism for capturing this dynamic behavior. They provide a visual language to describe how a system functions over time, moving data and control signals through various processes. This guide explores the technical depth of activity diagrams, offering a comprehensive look at their construction, semantics, and application in rigorous engineering environments.
Unlike static structural models, activity diagrams focus on the flow of control and the flow of data. They are essential for defining operational procedures, automated sequences, and decision logic within a system. By mapping these workflows, engineers can validate logic, identify bottlenecks, and ensure traceability from requirements to implementation.
Fundamentals of SysML Activity Diagrams 🧠
An activity diagram is a behavioral diagram that depicts the flow of control and data flow. In the Systems Modeling Language (SysML), these diagrams are more than simple flowcharts. They are formal representations of system behavior that adhere to the Object Management Group (OMG) standards. This formalism allows for model-based systems engineering (MBSE) tools to perform analysis, simulation, and verification.
The core purpose of an activity diagram is to answer specific questions about system operation:
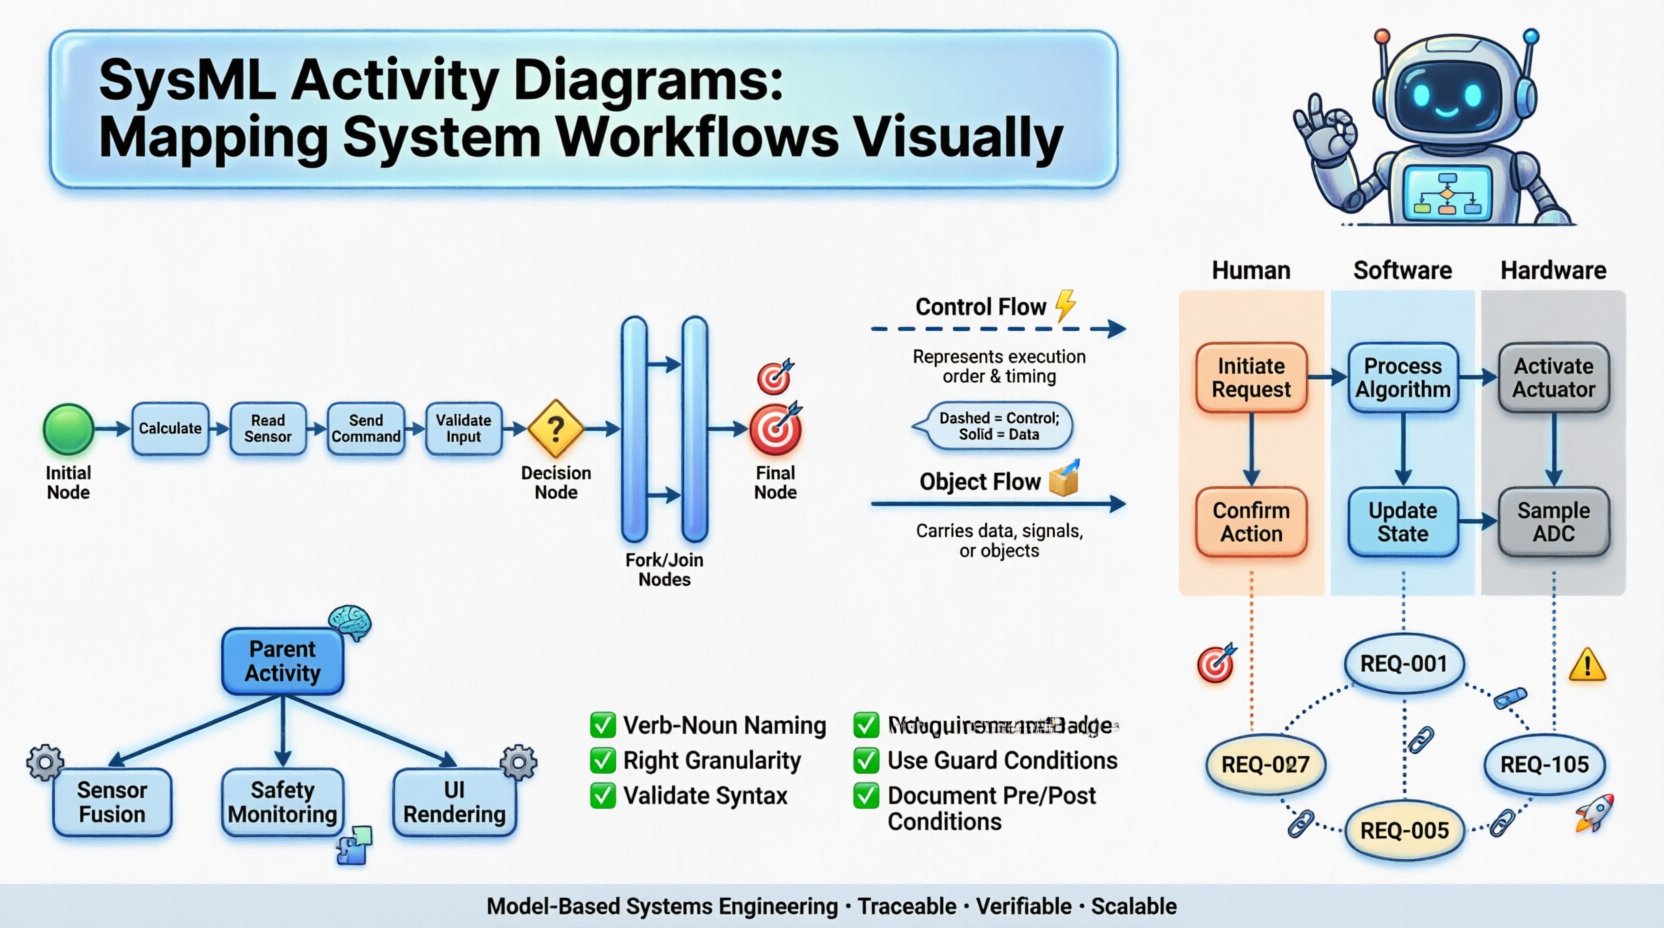
- What actions must be performed to achieve a goal? 🎯
- In what order do these actions occur? ⏱️
- How is data passed between these actions? 📦
- Where do decisions alter the flow of execution? 🚦
- How are responsibilities distributed among different system components? 🛠️
These diagrams are highly versatile. They can model everything from high-level business processes to detailed low-level control logic. The granularity is determined by the level of abstraction required for the specific engineering phase.
Core Structural Elements 🔨
To construct a valid activity diagram, one must understand the building blocks defined by the SysML specification. These elements combine to create complex behaviors from simple primitives.
Actions and Behaviors 🏗️
An Action is the fundamental unit of behavior. It represents a unit of work or a specific operation performed by the system. Actions can be:
- Primitive: Basic operations like “Calculate” or “Read”.
- Call Behavior: Invoking another behavior defined elsewhere in the model.
- ExecutionSpecification: Instances of actions that occur during runtime.
Each action has an input and output interface. This allows for the chaining of actions where the output of one becomes the input of another. This modularity is crucial for maintaining large-scale models.
Nodes and Control Flow 🔗
Nodes define the control flow, determining the sequence in which actions are executed. The standard nodes include:
- Initial Node: The starting point of the diagram. It has one outgoing edge and no incoming edges.
- Final Node: The termination point where the activity ends successfully.
- Decision Node: A diamond shape that routes control flow based on a condition. It has one incoming edge and multiple outgoing edges.
- Fork Node: Splits a single flow into multiple concurrent flows.
- Join Node: Merges multiple concurrent flows into a single flow.
- Activity Final Node: Similar to a final node but indicates the termination of the entire activity, including all concurrent flows.
Flows and Data Objects 📥
While control nodes manage the sequence, Object Flows manage the movement of data. An object flow connects an output pin of an action to an input pin of another action. This represents the transfer of information, such as a sensor reading or a command signal.
Data objects within these flows are typed. A SysML modeler must define the data type to ensure type safety across the system. This prevents logical errors where incompatible data is passed between processes.
Control Flow vs Object Flow 🔄
Understanding the distinction between control flow and object flow is critical for accurate modeling. Confusing the two can lead to simulation errors or incorrect verification results. The table below outlines the key differences.
| Feature | Control Flow | Object Flow |
|---|---|---|
| Purpose | Manages the sequence of actions. | Manages the movement of data. |
| Arrow Type | Open arrow head. | Open arrow head. |
| Dependency | Requires tokens to trigger actions. | Requires data objects to be produced. |
| Concurrency | Can be forked/joined. | Can be forked/joined. |
| Example | Start → Process → End. | Data → Process → Result. |
In practice, both flows often coexist. A control token triggers an action, and that action produces an object flow. This dual-mechanism allows for robust modeling of systems that are both data-driven and logic-driven.
Building Hierarchical Models 📊
One of the strengths of SysML activity diagrams is their ability to support hierarchical decomposition. Complex systems cannot be modeled in a single flat diagram without becoming unreadable. Hierarchical modeling allows engineers to break down activities into sub-activities.
- Delegation: An action in a parent diagram can delegate its behavior to a sub-activity diagram.
- Entry/Exit Points: Sub-activities must have defined entry and exit points to ensure proper flow integration.
- Scope: Variables and parameters can be scoped to the activity, reducing ambiguity in global variables.
This approach supports the “divide and conquer” strategy in systems engineering. A high-level diagram shows the major system phases, while lower-level diagrams detail the logic of specific subsystems. This separation of concerns is vital for team collaboration, as different teams can work on different sub-diagrams simultaneously.
Partitions and Swimlanes 🛣️
When a system involves multiple stakeholders or distinct subsystems, Partitions (often called Swimlanes) are used. A partition represents a classifier that is responsible for executing the actions within that region.
Common use cases for partitions include:
- Human vs. Machine: Distinguishing between operator inputs and automated system responses.
- Subsystem Boundaries: Separating logic for the propulsion system from the guidance system.
- Temporal Phases: Grouping actions by time windows or operational modes.
Using partitions clarifies ownership and responsibility. It answers the question: “Who or what is responsible for this specific action?”. This is particularly useful during verification and validation (V&V) processes, where specific test cases must be assigned to specific subsystems.
Integration with System Requirements 📝
Activity diagrams do not exist in isolation. They must be linked to the requirements that drive the system behavior. SysML supports Requirement Traceability, allowing a requirement to be linked to an activity or action.
This traceability enables several critical engineering functions:
- Impact Analysis: If a requirement changes, engineers can immediately see which activities are affected.
- Coverage Verification: Engineers can verify that every requirement has a corresponding behavior in the model.
- Gap Analysis: Identifying behaviors that are not linked to any requirement (gold-plating) or requirements that have no implementation.
To maintain this link, each action should ideally be traced to a specific requirement ID. This creates a bidirectional link where the model drives the requirement and the requirement validates the model.
Best Practices for Modeling 🛠️
Creating a valid diagram is one thing; creating a maintainable and clear model is another. Adhering to best practices ensures the diagram remains useful throughout the lifecycle of the project.
Consistent Naming Conventions 🏷️
Names in SysML must be unique within a scope. Actions should be named using the pattern “Verb Noun” (e.g., “Initialize Engine”, “Read Sensor”). This convention improves readability and ensures that the diagram can be understood without reading the underlying code or external documentation.
Appropriate Granularity 📏
A common mistake is creating activities that are too detailed. If an action is too simple, it should be removed and merged with its neighbors. If an action is too complex, it should be decomposed into a sub-activity. The rule of thumb is to keep actions at a level where they can be implemented or tested in isolation.
Minimize Cross-Partition Flows 🚧
While cross-partition flows are necessary, excessive crossing lines make diagrams difficult to read. Designers should strive to group related actions within the same partition. If data must pass between partitions, ensure the flow is clearly labeled and the direction is obvious.
Validation and Syntax Checks ✅
Before sharing a diagram, run syntax checks. Ensure all nodes have valid connections. A dangling edge or an isolated node indicates an error in the model. Automated tools can detect missing flows or unconnected initial nodes, saving significant debugging time later.
Common Modeling Challenges ⚠️
Even experienced modelers encounter difficulties. Recognizing these challenges early can prevent rework.
Deadlocks and Livelocks
A Deadlock occurs when control flow reaches a state where no further progress can be made. This often happens at join nodes where one incoming flow is missing. A Livelock occurs when the system loops indefinitely without making progress. These must be avoided through rigorous simulation.
Ambiguous Decision Logic
Decision nodes require guard conditions. If guard conditions are not mutually exclusive or exhaustive, the behavior becomes ambiguous. For example, if a condition is “If Temperature > 100” and another is “If Temperature > 80”, the second condition is redundant. Conditions must be clear and deterministic.
Data Flow Complexity
Tracking data objects through complex diagrams can be overwhelming. If too many object flows are present, it becomes hard to verify data integrity. It is recommended to focus object flows on critical data paths and simplify the control flow for clarity.
Application in Lifecycle Phases 🚀
Activity diagrams are not static documents; they evolve with the system lifecycle. Their application changes depending on the phase of development.
- Conceptual Phase: High-level diagrams define the operational concept. They focus on the “What” and “Why” of the system behavior.
- Definition Phase: Detailed diagrams define the logic. They focus on the “How”. Input and output parameters are defined.
- Implementation Phase: Diagrams are used to generate code or test scripts. They must be precise enough to be executable.
- Verification Phase: Diagrams serve as the baseline for testing. Test cases are derived directly from the activity paths.
- Maintenance Phase: Diagrams document the current state of the system. They help new engineers understand the legacy logic.
Advanced Features: Acceptance Conditions and Parameter Nodes 🎛️
For complex systems, basic flows are often insufficient. SysML provides advanced features to handle intricate logic.
Acceptance Conditions
An Acceptance Condition is a guard condition that must be satisfied before an action can complete. This is distinct from a decision node. A decision node routes control; an acceptance condition validates the outcome of an action. For example, a “Validate Payload” action might have an acceptance condition that checks if the checksum matches before proceeding.
Parameter Nodes
Parameter nodes allow for the definition of inputs and outputs at the activity level. This defines the interface of the activity. Parameters can be passed between activities without being explicitly defined as object flows on every single edge. This simplifies the visual representation of the model.
Ensuring Model Consistency 🧩
Consistency across the model is a major challenge. As the system grows, activity diagrams must remain consistent with other diagram types.
- State Machine Consistency: Ensure that states in a state machine do not conflict with actions in an activity diagram.
- Sequence Diagram Consistency: The messages exchanged in a sequence diagram should match the flows in the activity diagram.
- Block Definition Consistency: The blocks involved in the activity must match the structural definition of the system.
Model consistency tools are essential for large projects. They alert the engineer when a change in one diagram breaks the logic in another. This proactive approach prevents the accumulation of technical debt in the model.
Summary of Capabilities 🏁
SysML activity diagrams are a cornerstone of model-based systems engineering. They provide the necessary abstraction to manage system complexity while maintaining the rigor required for verification. By leveraging control flows, object flows, and partitions, engineers can create models that are both human-readable and machine-analyzable.
The key to success lies in disciplined modeling. Adhering to naming conventions, managing granularity, and maintaining traceability to requirements ensures that the diagrams remain valuable assets throughout the project lifecycle. Whether used for high-level operational analysis or detailed logic verification, these diagrams bridge the gap between abstract requirements and concrete implementation.
As systems continue to grow in complexity, the role of precise behavioral modeling will only increase. Investing time in mastering these diagrams pays dividends in reduced risk, clearer communication, and more robust system designs.