Strategic planning forms the backbone of successful business operations. Among the various frameworks available, the SWOT analysis remains one of the most widely used tools in academic and professional settings. However, despite its ubiquity, many students and practitioners struggle to derive meaningful insights from it. A poorly constructed SWOT analysis can lead to misguided strategies, wasted resources, and a lack of direction.
The issue often lies not in the framework itself, but in how it is applied. Too often, the process becomes a box-ticking exercise rather than a rigorous evaluation of the current business landscape. This guide addresses the specific pitfalls that derail the effectiveness of SWOT assessments and provides concrete methods to correct them. By understanding these errors, you can transform a generic list of bullet points into a powerful strategic asset.
Understanding the Core Framework 🧩
Before identifying where things go wrong, it is necessary to establish what the SWOT analysis actually represents. The acronym stands for Strengths, Weaknesses, Opportunities, and Threats. It is a diagnostic tool designed to map internal capabilities against external environmental factors.
- Strengths: Internal attributes that give an organization an advantage over others.
- Weaknesses: Internal attributes that place the organization at a disadvantage relative to others.
- Opportunities: External chances to make progress or gain an advantage.
- Threats: External elements that could cause trouble for the business or project.
The fundamental logic of this model requires a strict separation between what is inside your control and what is outside your control. Confusing these domains is the root cause of most analytical failures. When the internal and external are blurred, the resulting strategy lacks focus.
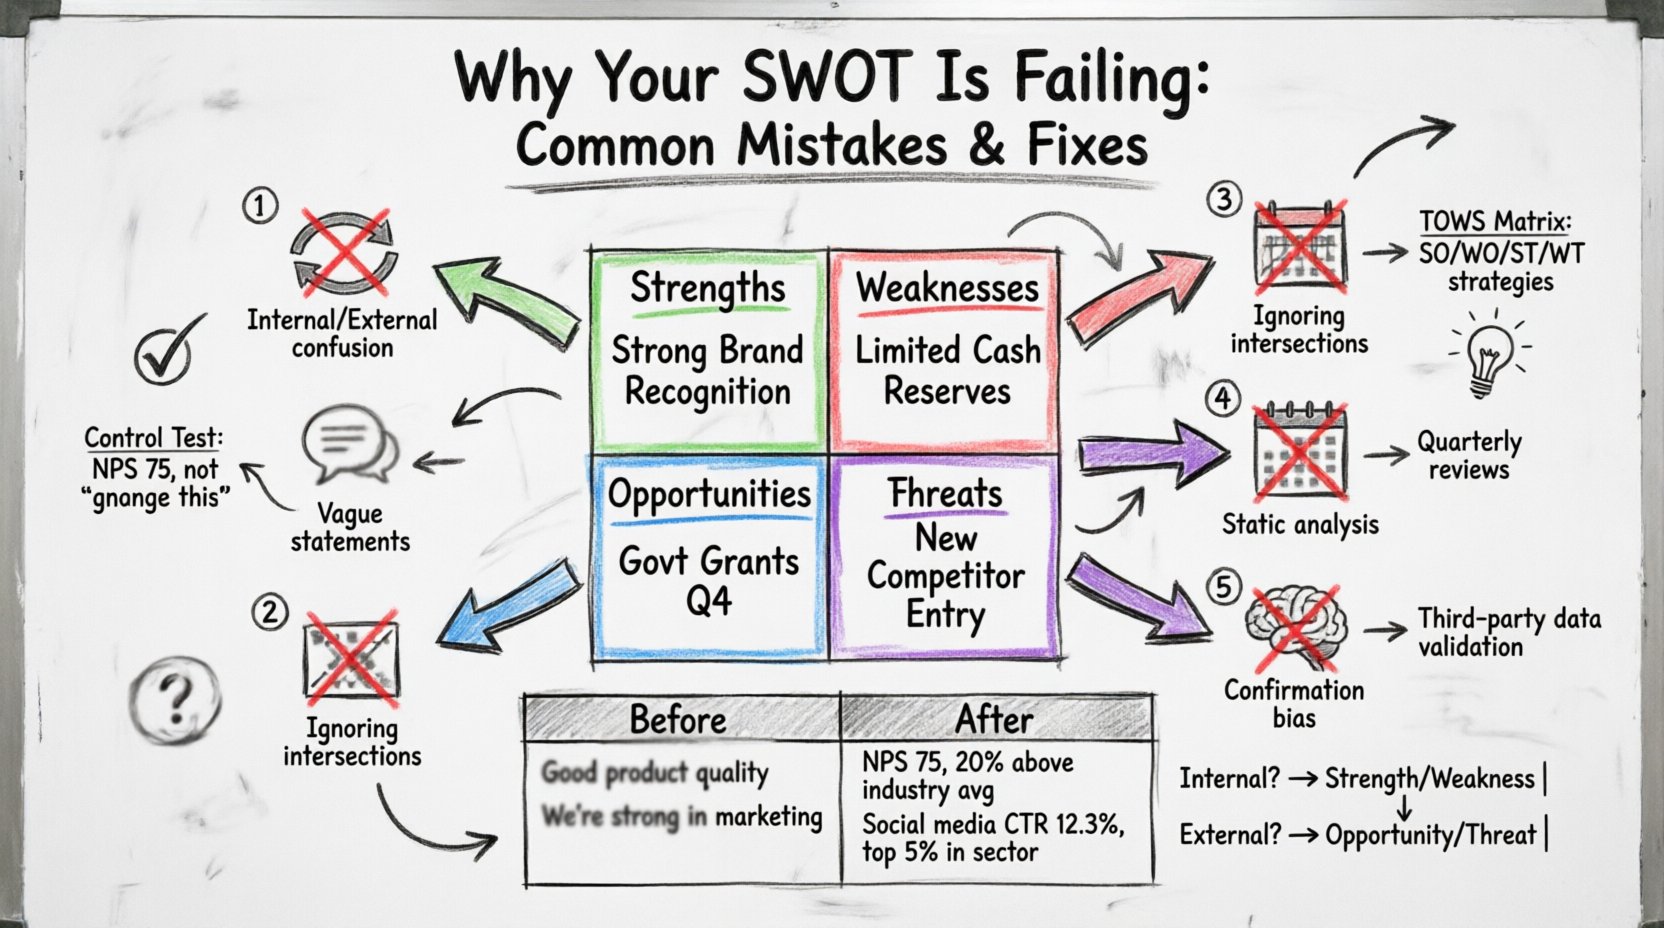
Top 5 Mistakes in SWOT Analysis ❌
Students frequently encounter the same structural and conceptual errors. These mistakes reduce the utility of the document from a strategic roadmap to a simple list of observations. Below are the most prevalent errors and why they undermine the process.
1. Confusing Internal with External Factors 🔄
This is the most common error. A classic example is listing “High Market Demand” as a Strength. Market demand is an external condition, not an internal capability. If the market shifts, this factor changes regardless of your internal actions.
- Correct Classification: “High Market Demand” belongs in Opportunities.
- Correct Strength: “Strong Brand Recognition” allows you to capitalize on that demand.
When internal and external factors are mixed, the team cannot determine which actions to take. Strategies for strengths require internal resource allocation, while strategies for opportunities require external market engagement.
2. Vague and Non-Actionable Statements 🗣️
Generic statements such as “Good Quality” or “Competitive Pricing” provide no strategic value. They are subjective and difficult to measure. If you cannot quantify the attribute, you cannot manage it.
- Weak Entry: “Our team is experienced.”
- Why it fails: How experienced? What specific skills?
- Strong Entry: “Our engineering team holds 50 years of combined experience in legacy system migration.”
- Why it works: Specific, quantifiable, and directly applicable to project bidding.
Without specificity, the analysis cannot inform decision-making. Stakeholders need data to justify resource allocation.
3. Ignoring the Relationships Between Quadrants 📊
A standard SWOT grid lists four separate items. However, the real power lies in the intersections. Simply listing items without connecting them is a missed opportunity. This is often referred to as the TOWS matrix approach.
- SO Strategies: How can you use Strengths to maximize Opportunities?
- WO Strategies: How can you overcome Weaknesses to take advantage of Opportunities?
- ST Strategies: How can you use Strengths to minimize Threats?
- WT Strategies: How can you minimize Weaknesses to avoid Threats?
Most student submissions stop at the listing phase. They fail to synthesize the data into actionable strategic pathways.
4. Treating the Analysis as Static 📅
Business environments are dynamic. A SWOT analysis created today may be obsolete in six months due to regulatory changes, technological shifts, or competitor moves. Treating it as a one-time document leads to outdated strategies.
- External threats evolve rapidly (e.g., new legislation).
- Internal strengths degrade without maintenance (e.g., staff turnover).
- Opportunities window closes quickly (e.g., seasonal trends).
Failing to schedule regular reviews means the strategy is based on historical data rather than current reality.
5. Subjectivity and Confirmation Bias 🧠
Teams often fill out the SWOT based on feelings rather than evidence. There is a tendency to list only positive internal traits (Strengths) and ignore negative ones (Weaknesses) to maintain morale. Conversely, external factors are often viewed with unwarranted pessimism or optimism.
- Confirmation Bias: Seeking evidence that supports pre-existing beliefs.
- Groupthink: Agreeing with the loudest voice in the room rather than objective data.
This results in a skewed view of the organization. A strategic plan based on false premises is destined to fail.
Common Errors and How to Fix Them 🛠️
The following table summarizes the most critical errors and provides specific corrective actions. This structure allows for quick reference during the review process.
| Mistake | Consequence | Corrective Action |
|---|---|---|
| Mixing Internal/External | Confused Strategy | Apply the Control Test: Can we directly change this? |
| Vague Statements | Unmeasurable Outcomes | Require specific metrics or data points for every entry. |
| Ignoring Intersections | Lost Opportunities | Create a TOWS matrix to link quadrants. |
| Static Approach | Obsolescence | Schedule quarterly reviews of the analysis. |
| Subjective Bias | False Positives/Negatives | Use third-party data and anonymous feedback. |
Corrective Strategies for Each Error 🔧
Addressing these mistakes requires a shift in methodology. Below is a detailed breakdown of how to implement the fixes.
Implementing the Control Test
To ensure accurate classification, apply the Control Test to every item listed. Ask: “Can we change this factor through our own actions?”
- If Yes: It is Internal (Strength or Weakness).
- If No: It is External (Opportunity or Threat).
This simple question forces clarity. For example, “Inflation” is external. “Our Cost Structure” is internal. Understanding this distinction prevents the misallocation of effort.
Enforcing Data-Driven Entries
Adopt a policy where no bullet point is accepted without supporting evidence. This moves the analysis from opinion to fact.
- Instead of: “High Customer Satisfaction.”
- Use: “Net Promoter Score of 75, top 10% in industry.”
- Instead of: “Rising Competitor Prices.”
- Use: “Competitor X increased prices by 15% in Q3.”
This level of detail allows for precise benchmarking and tracking over time.
Developing the TOWS Matrix
Once the four quadrants are populated, move to the synthesis phase. Do not stop at the list. Create a matrix that maps the interactions.
Example: If Strength is “Patented Technology” and Threat is “New Entrants with Copycat Tech”, the strategy is to “Expand Patent Portfolio to cover derivatives”.
This forces the team to think about how assets interact with risks, leading to proactive rather than reactive planning.
Advanced Application: Beyond the Basics 🚀
For those looking to deepen the analysis, consider integrating other frameworks. SWOT should rarely stand alone in a mature strategic context.
Integration with PESTLE
The PESTLE framework (Political, Economic, Social, Technological, Legal, Environmental) provides a structured way to generate the Opportunities and Threats sections of your SWOT.
- Political: Trade agreements, tax policies.
- Economic: Inflation rates, exchange rates.
- Social: Demographics, lifestyle trends.
- Technological: R&D activity, automation.
- Legal: Employment laws, safety standards.
- Environmental: Carbon footprint, sustainability.
Using PESTLE ensures that the external analysis is comprehensive and not limited to immediate industry competitors.
Integration with Porter’s Five Forces
Porter’s model analyzes industry attractiveness. The results can feed directly into the Threats section.
- Rivalry: Intensity of competition.
- Suppliers: Bargaining power of suppliers.
- Buyers: Bargaining power of customers.
- Substitutes: Availability of alternatives.
- Entry: Threat of new market entrants.
By combining these models, the SWOT becomes a robust summary of a deeper investigation.
Data Collection and Validation 📝
The quality of the SWOT depends entirely on the quality of the data. Relying on internal assumptions is a recipe for error. You must gather information from diverse sources.
- Internal Data: Financial reports, HR records, customer support logs.
- External Data: Industry reports, competitor filings, market research.
- Stakeholder Input: Interviews with customers, suppliers, and partners.
Validation is key. Cross-reference findings with at least two independent sources. If one source claims a threat exists but no other data supports it, treat it as a hypothesis rather than a fact.
Real-World Application Scenarios 🏢
To illustrate the difference between a failing and a successful SWOT, consider two hypothetical scenarios.
Scenario A: The Standard Student Approach
Strength: Good team. Weakness: Not enough money. Opportunity: Market is growing. Threat: Competitors are dangerous.
Result: This provides no actionable insight. The team does not know what specific skills they have, how much money is needed, which segment of the market is growing, or which competitors pose a threat.
Scenario B: The Strategic Approach
Strength: Proprietary algorithm reduces processing time by 40%. Weakness: Current cash reserves cover only 3 months of operations. Opportunity: Government grants for tech startups available in Q4. Threat: Competitor Y announced a similar feature last month.
Result: The strategy is clear. The team needs to apply for grants (Opportunity) to fix the cash flow (Weakness) while leveraging the algorithm (Strength) to stay ahead of Competitor Y (Threat).
Final Thoughts on Strategic Clarity 🔍
A SWOT analysis is only as valuable as the rigor applied to its creation. It is a tool for clarity, not a document for approval. When students and professionals treat it as a critical thinking exercise rather than a formatting task, the results change drastically.
Focus on accuracy over quantity. Ten specific, data-backed points are more useful than fifty vague statements. Ensure the internal and external factors are distinct. Validate every claim with evidence. Connect the quadrants to form a cohesive strategy.
By avoiding these common pitfalls, you ensure that the SWOT analysis serves its true purpose: illuminating the path forward in a complex business environment. The goal is not just to complete the assignment, but to generate insights that drive real decision-making.
Continuous improvement of this process is essential. Regularly revisit your analysis to ensure it reflects the current state of affairs. Adaptability is the hallmark of successful strategic management.