In complex software architectures, understanding the flow of data and control is critical. When a request enters a system, it triggers a cascade of events across multiple components. Without a clear map of these interactions, development becomes a guessing game. UML sequence diagrams provide this map. They allow architects and developers to visualize the temporal ordering of messages between objects. This visualization is not merely documentation; it is a predictive tool.
By modeling interactions before code is written, teams can identify logical gaps, race conditions, and architectural bottlenecks early. This guide explores how to leverage these diagrams to predict system behavior with precision. We will cover the anatomy of the diagram, the semantics of message passing, and advanced patterns that clarify complex flows.
🧩 The Anatomy of a Sequence Diagram
A sequence diagram is a type of interaction diagram. It shows how objects interact with one another in a specific sequence. The horizontal axis represents the participants, while the vertical axis represents time. Moving down the page corresponds to the progression of events.
🔹 Participants and Lifelines
Every interaction involves participants. These can be:
- Objects: Instances of a class.
- Classes: Abstract types when objects do not yet exist.
- Actors: External entities, such as users or third-party systems.
- Systems: The entire application boundary.
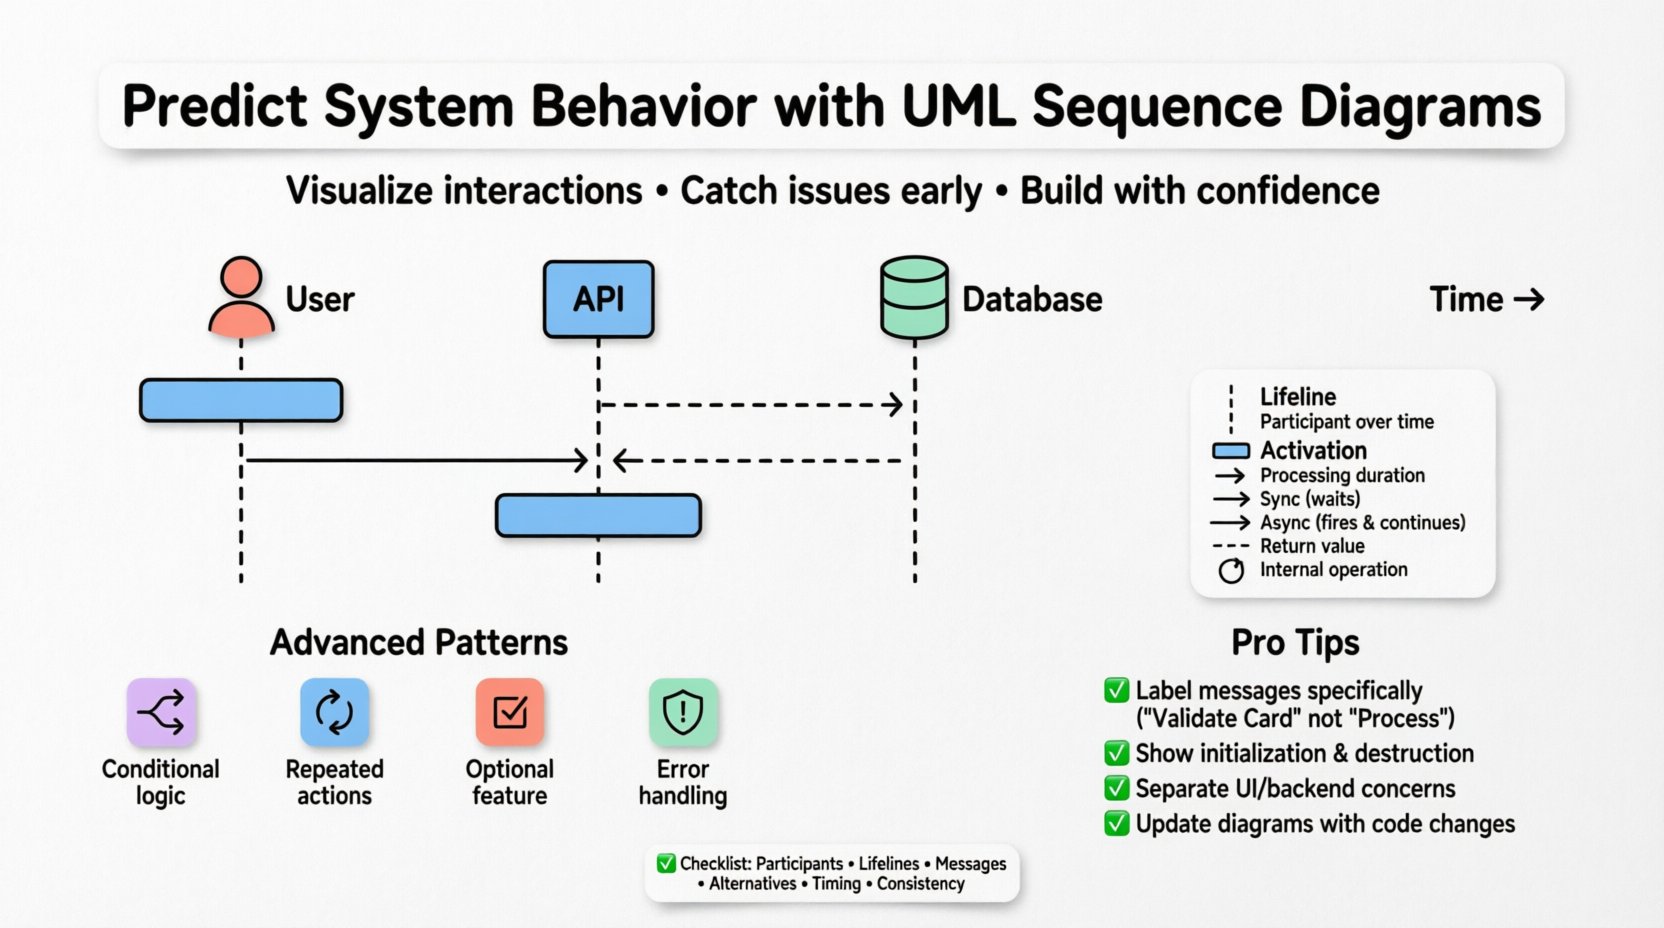
Each participant is represented by a vertical dashed line called a lifeline. This line indicates the existence of the participant over time. If a lifeline extends to the bottom of the diagram, the object persists throughout the interaction. If it ends prematurely, the object is destroyed or goes out of scope.
🔹 Activation Bars
Within a lifeline, a rectangular box appears where the participant is actively performing work. This is known as an activation bar or control focus. The height of this bar represents the duration of the activity. It helps visualize when a thread of control is busy versus when it is waiting for a response.
🔹 Messages and Returns
Messages are the arrows connecting activation bars. They represent the flow of data or commands. There are distinct types of arrows, each carrying specific meaning:
- Synchronous Call: A solid line with a filled arrowhead. The sender waits for the receiver to complete the action before continuing.
- Asynchronous Call: A solid line with an open arrowhead. The sender fires the message and continues immediately without waiting.
- Return Message: A dashed line with an open arrowhead. It indicates data flowing back from the receiver to the sender.
- Self-Message: An arrow that starts and ends on the same activation bar. This represents an internal operation.
🔮 Predicting Behavior Through Forward Engineering
Prediction begins with forward engineering. This involves creating the diagram to define the expected behavior before implementation starts. By defining the contract of interaction, developers know exactly what to build.
🔹 Identifying Critical Paths
When designing a new feature, the primary goal is to map the happy path. However, prediction requires anticipating deviations. A robust sequence diagram includes alternative flows. This allows the team to see how the system handles errors or optional data before writing a single line of logic.
🔹 State Implications
Messages often trigger state changes. A sequence diagram implies the state of objects at specific points in time. For example, if Object A sends a message to Object B to “Close Account,” Object B must be in an “Open” state to accept that command. If the diagram shows a message arriving when the object is in a “Closed” state, the model reveals a logic error.
🔹 Resource Constraints
Predicting behavior also involves resource usage. Long activation bars indicate heavy processing. If multiple participants have long activation bars simultaneously, it suggests a potential bottleneck or a need for parallel processing. This insight helps in capacity planning.
🔄 Advanced Interaction Patterns
Standard message passing is rarely enough for complex systems. UML provides combined fragments to handle logic, repetition, and selection. These constructs are essential for accurate prediction.
🔹 Alt (Alternative)
The alt fragment represents conditional logic. It splits the interaction into multiple alternatives based on a guard condition. For example, a payment system might have one path for successful validation and another for failure. Using alt ensures that every possible branch of logic is visualized.
🔹 Loop
The loop fragment indicates repeated behavior. It is used when a message is sent multiple times, such as iterating through a list of items. The guard condition inside the loop specifies how many times the interaction repeats. This prevents the diagram from becoming cluttered with dozens of identical arrows.
🔹 Opt (Optional)
The opt fragment denotes a single optional path. Unlike alt, which handles mutually exclusive choices, opt highlights a feature that may or may not occur. This is useful for modeling optional features like “Send Email Notification” that depend on user preferences.
🔹 Break
The break fragment handles exceptions. It allows you to show what happens when an error occurs without cluttering the main flow. This is crucial for predicting how the system recovers from faults.
⏱️ Timing and Constraints
Prediction is not just about order; it is about time. Real-world systems have deadlines and timeouts. Sequence diagrams can capture these constraints.
🔹 Time Bars
A horizontal time bar can be placed over a lifeline to indicate a specific duration. For instance, a “Timeout” bar might show that if a response is not received within 5 seconds, the process terminates. This visual cue helps engineers understand latency requirements.
🔹 Delay Operators
Delays are used when the exact timing is unknown but the order matters. A delay operator indicates a pause in the sequence. This is helpful when modeling asynchronous background processes that do not block the main thread but must eventually complete.
📊 Comparing Message Types
Choosing the right message type affects the predictability of the system. The table below outlines the differences.
| Message Type | Arrow Style | Behavior | Use Case |
|---|---|---|---|
| Synchronous | Filled Head | Blocks sender until completion | Critical data retrieval |
| Asynchronous | Open Head | Non-blocking | Event logging, notifications |
| Return | Dashed Line | Response data | Acknowledgment, results |
| Creation | Open Head + “create” | Instantiates new object | Factory patterns |
| Destruction | X on Lifeline | Removes object | Cleanup, scope exit |
🛠️ Common Pitfalls in Modeling
Even with the best intentions, diagrams can become misleading. To maintain predictive accuracy, avoid these common mistakes.
🔹 Overcrowding
Putting too many interactions on one page makes the diagram unreadable. If a sequence involves more than 10-15 participants, consider breaking it into sub-diagrams or using generalization.
🔹 Ambiguous Labels
Labels like “Process” or “Handle” are too vague. Use specific verbs and nouns, such as “Validate Credit Card” or “Fetch User Profile.” Specificity reduces ambiguity during implementation.
🔹 Ignoring Initialization
A diagram that starts in the middle of the flow is confusing. Always show the initialization steps. How are the objects created? What is the initial state? Without this context, the prediction is incomplete.
🔹 Mixing Concerns
Do not mix user interface logic with backend logic in the same diagram unless necessary. Separate the interaction between the client and the server from the internal processing within the server. This separation clarifies the boundary of responsibility.
🧪 Integration with Testing Strategies
Sequence diagrams are not static artifacts; they drive testing. They serve as the blueprint for integration tests and contract testing.
🔹 Test Case Generation
Each message path can be converted into a test case. The alt fragments become test scenarios for positive and negative conditions. The loop fragments guide the creation of boundary value tests for iteration counts.
🔹 Mocking Dependencies
When writing unit tests, developers often need to mock external dependencies. The sequence diagram defines exactly which methods need to be mocked. If a diagram shows a call to an external API, the test suite must simulate that call without hitting the real network.
🔹 Regression Verification
When the system changes, the diagram should be updated. Comparing the old diagram with the new one reveals unintended side effects. If a message path has been removed or altered, it flags a potential regression before deployment.
🔄 Maintenance and Evolution
Software evolves. Requirements change. A sequence diagram that is accurate today may be obsolete tomorrow. Maintaining these models is essential for long-term predictability.
🔹 Version Control
Treat diagrams as code. Store them in version control systems. This allows teams to track changes over time and revert to previous states if new features introduce bugs.
🔹 Living Documentation
Avoid the “write once, ignore forever” approach. Update diagrams during code reviews. If the code deviates from the model, update the model. This ensures the diagram remains a true reflection of the system.
🔹 Collaboration
Diagrams are a communication tool. Use them in sprint planning sessions. Walk through the flows with the entire team. Discrepancies found during discussion are cheaper to fix than bugs found in production.
🧭 Final Thoughts on System Prediction
Predicting system behavior is about reducing uncertainty. UML sequence diagrams are a powerful mechanism for achieving this clarity. They translate abstract requirements into concrete interaction flows. By focusing on the temporal order of messages, teams can foresee issues related to concurrency, state management, and error handling.
Success with this approach requires discipline. It demands that the diagrams remain accurate and that the team treats them as active design documents rather than passive archives. When maintained correctly, these diagrams become the foundation for robust, reliable, and scalable software systems.
✅ Checklist for Effective Modeling
Use this list to validate your sequence diagrams before moving to development.
- Participants Defined: Are all objects and actors clearly labeled?
- Lifelines Complete: Do lifelines start at creation and end at destruction?
- Message Clarity: Are all messages specific and descriptive?
- Control Flow: Are activation bars consistent with the logic?
- Alternative Paths: Are error conditions and optional features modeled?
- Timing Constraints: Are timeouts and delays represented where critical?
- Consistency: Does the diagram match the current state of the codebase?
- Readability: Is the diagram free of overlapping lines and clutter?