
Business planning is rarely a linear journey. Markets shift, customer needs evolve, and initial assumptions often prove incorrect. This is where the concept of a pivot becomes essential. A pivot is not a failure; it is a strategic correction based on evidence. To navigate this effectively, entrepreneurs and strategists rely on the Business Model Canvas (BMC). This tool visualizes the logic of how an organization creates, delivers, and captures value. However, a static canvas is a liability in a dynamic economy. The true power lies in adjusting the nine building blocks of the canvas using real market data rather than intuition.
This guide explores the mechanics of pivoting your Business Model Canvas. We will examine how to gather evidence, identify signals, and modify specific elements to align with market reality. By grounding your strategy in data, you reduce risk and increase the probability of sustainable growth.
📊 Why Data-Driven Pivots Matter
Many ventures fail because they cling to an original hypothesis long after the data suggests it is obsolete. This is often called “falling in love with the solution” rather than the problem. When you base decisions on real market data, you move from speculation to validation.
Here are the core benefits of using data to guide your pivot:
- Reduced Risk: Testing assumptions before committing significant resources prevents catastrophic loss.
- Faster Iteration: Small adjustments based on feedback loops allow for quicker adaptation than large-scale overhauls.
- Customer Alignment: Data reveals what customers actually value, not what you think they should value.
- Resource Efficiency: You stop spending time and money on features or channels that do not convert.
Without data, a pivot is a guess. With data, a pivot is a calculated strategy. The Business Model Canvas provides the structure to map these changes clearly across the entire organization.
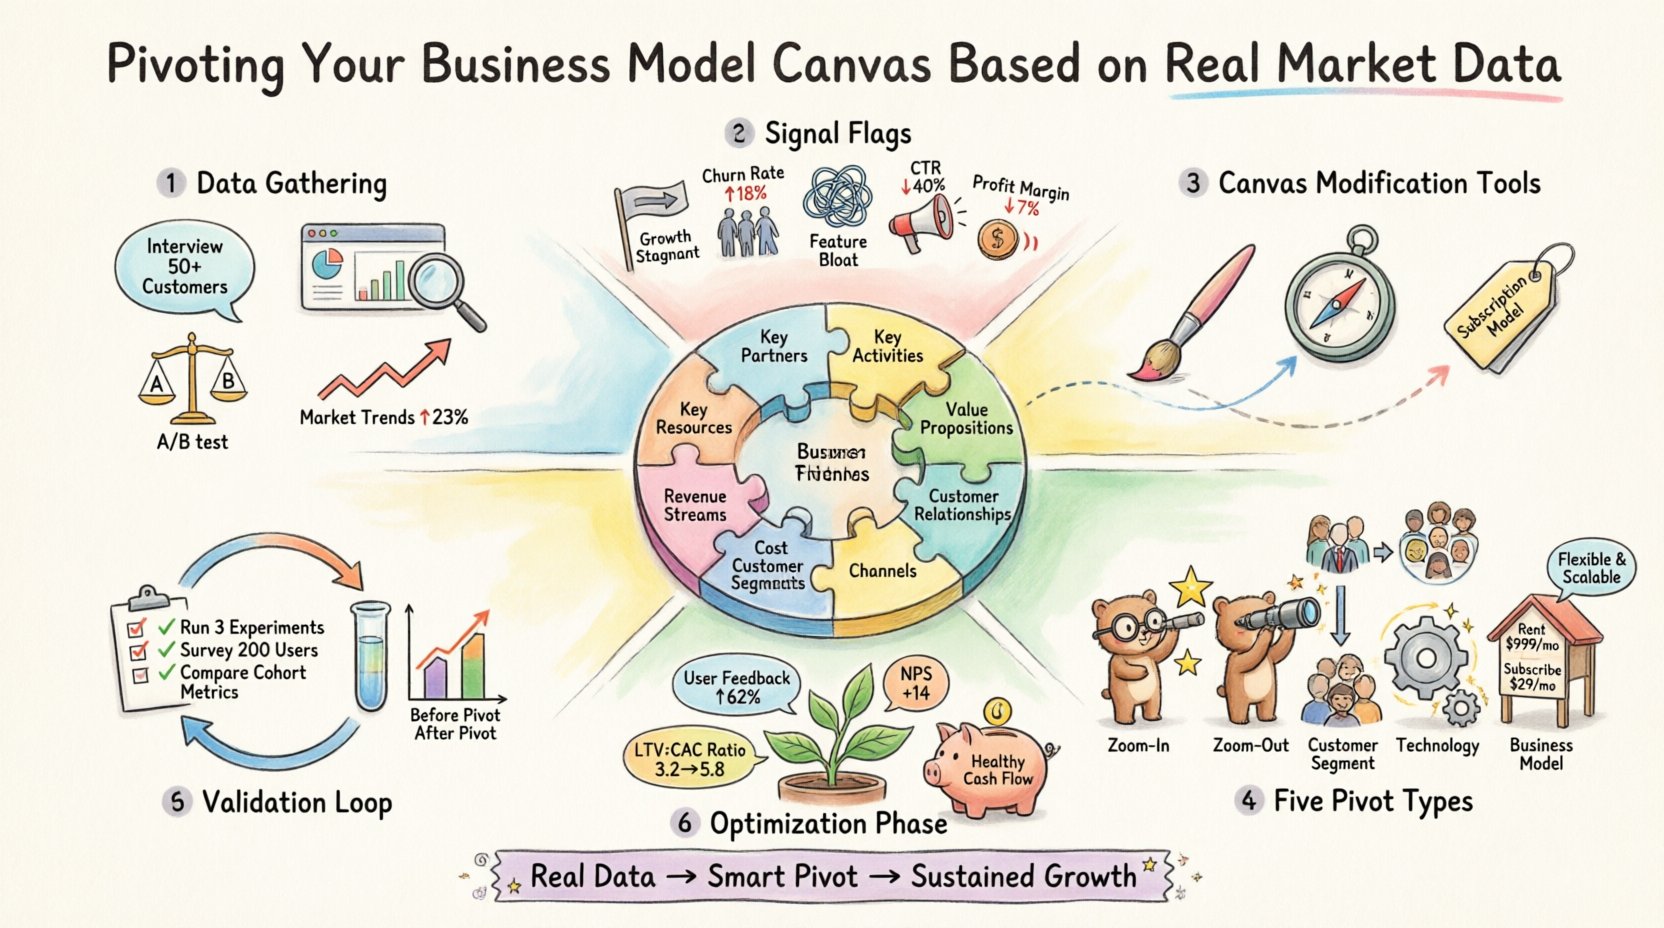
🔍 Gathering Evidence: The Data Sources
Before changing the canvas, you need reliable information. Relying on anecdotal evidence or internal opinions is insufficient. You need direct input from the market. Here are the primary methods to collect this data without relying on specific proprietary tools.
1. Customer Interviews
Direct conversations provide qualitative depth. Ask open-ended questions about their current workflows, pain points, and willingness to pay. Listen for patterns in their feedback rather than isolated incidents.
2. Usage Analytics
Behavioral data shows what users do, not just what they say. Track where users drop off, which features are used most, and how long they stay engaged. This quantitative data validates or refutes user claims.
3. A/B Testing
Present two variations of a value proposition or pricing model to different segments. Measure conversion rates to see which option performs better. This isolates variables to determine what drives action.
4. Market Trends
Look at broader industry shifts. Regulatory changes, technological advancements, or competitor movements can signal that your current model is becoming obsolete. External reports and public data sets are valuable here.
🚩 Recognizing the Signals for a Pivot
When should you consider changing the canvas? Waiting too long can drain resources. Waiting too soon can lead to instability. Look for these specific indicators that suggest a pivot is necessary.
- Stagnant Growth: Customer acquisition costs rise while revenue remains flat.
- Low Retention: Users sign up but do not return. This indicates a mismatch between value proposition and customer needs.
- Feature Creep: You are building complex features that customers ignore, while basic needs remain unmet.
- Channel Fatigue: Marketing channels that previously worked stop delivering leads.
- Margin Compression: Costs are eating into profits, suggesting the cost structure needs adjustment.
These signals are not always negative; they are feedback mechanisms. They tell you that the current configuration of your Business Model Canvas is inefficient for the current market environment.
🛠️ The Pivot Process: Modifying the Canvas
Once a signal is identified, you must determine which block of the Business Model Canvas requires adjustment. The canvas consists of nine distinct elements. Changing one often impacts others. You must analyze the interconnectivity before making changes.
Below is a breakdown of how market data influences specific blocks and the types of pivots associated with them.
Table: Data Signals and Canvas Adjustments
| Canvas Block | Data Signal | Pivot Action |
|---|---|---|
| Customer Segments | Low adoption in target group | Shift to a different demographic or industry. |
| Value Proposition | Customers cite wrong problem | Refine the core benefit or solve a different pain point. |
| Channels | High acquisition cost in current path | Move to organic, referral, or partner-led distribution. |
| Customer Relationships | High churn rate | Shift from self-service to high-touch support. |
| Revenue Streams | Price sensitivity too high | Switch from subscription to usage-based pricing. |
| Key Resources | Costs exceed value created | Outsource or reduce inventory and infrastructure. |
| Key Activities | Processes are bottlenecks | Automate manual tasks or streamline workflows. |
| Key Partners | Supply chain delays | Find alternative suppliers or vertical integration. |
| Cost Structure | Fixed costs too high | Shift to variable cost models or lean operations. |
Notice that the pivot actions are specific. You do not just “change the product.” You change the customer segment, the revenue model, or the delivery channel. Precision is key to a successful pivot.
🔄 Types of Pivots to Consider
Not all pivots are created equal. Depending on the data, you might choose a zoom-in pivot, a zoom-out pivot, or a complete model change. Understanding these types helps you frame the conversation with your team.
1. The Zoom-In Pivot
Sometimes a single feature becomes the entire product. Data may show that one specific aspect of your offering solves the core problem better than everything else. You pivot by making that feature the focal point and stripping away the rest of the original scope.
2. The Zoom-Out Pivot
Conversely, a single feature might be too narrow. If market data indicates the feature is only a small part of a larger solution, you pivot by expanding the scope to become a platform or a comprehensive suite. This turns a feature into a product.
3. The Customer Segment Pivot
Your product works, but the wrong people are buying it. You might discover that a different industry values your solution more highly. This pivot keeps the technology and value proposition intact but changes the target audience and marketing channels.
4. The Technology Pivot
Market data may reveal that a new technology allows you to deliver the same value more efficiently. You swap the underlying technology stack to reduce costs or improve performance without changing the customer experience.
5. The Business Model Pivot
This is a fundamental shift in how you capture value. For example, moving from a licensing model to a freemium model. This requires adjusting the Revenue Streams and Cost Structure blocks significantly.
🧪 Validating the New Direction
A pivot is not a final destination; it is a new hypothesis. Once you update the Business Model Canvas, you must validate the new configuration immediately. Do not assume the change worked just because you made it. Use the same data collection methods from the beginning to measure the new state.
Follow this validation loop:
- Define Metrics: Select the key performance indicators that matter for the new model. If you changed the pricing, track Average Revenue Per User. If you changed the segment, track acquisition rate for the new demographic.
- Run Small Tests: Do not roll out the change to 100% of users immediately. Use a beta group or a limited release to gather initial data.
- Compare Baselines: Measure the new metrics against the old baseline. Did the pivot improve the specific signal that triggered the change?
- Iterate: If the data is positive, proceed with full implementation. If not, analyze why and prepare for the next iteration.
Validation ensures that the pivot was effective. It prevents the organization from entering a cycle of constant, aimless changes.
⚖️ Risks and Mitigation Strategies
Pivoting carries inherent risks. Stakeholders may lose confidence, and resources may be wasted if the transition is poorly managed. Here is how to mitigate these risks.
- Communication Breakdown: Ensure the entire team understands the “why” behind the pivot. Share the market data that drove the decision. Transparency builds trust.
- Brand Confusion: If you change customer segments, your messaging must evolve. Ensure marketing materials reflect the new value proposition immediately to avoid confusing existing users.
- Team Morale: Pivots can feel like admissions of failure. Frame the pivot as a strategic evolution based on learning. Celebrate the insights gained from the data.
- Cash Flow: Pivots often require upfront investment. Ensure you have sufficient runway to sustain the transition period. Adjust the Cost Structure block to manage burn rate during this phase.
📈 Post-Pivot Optimization
Once the pivot is validated and implemented, the work is not over. You enter a phase of optimization. This involves refining the new model to maximize efficiency and growth.
Focus on the following areas:
- Operational Efficiency: As you scale the new model, identify bottlenecks in Key Activities. Automate where possible.
- Customer Feedback Loops: Maintain a continuous channel for customer input. The market will shift again, and you need to be ready to pivot again.
- Financial Health: Monitor the Cost Structure and Revenue Streams closely. Ensure the new model is profitable.
Optimization turns a successful pivot into a sustainable business. It solidifies the changes and prepares the organization for long-term stability.
🎯 Conclusion
Pivoting your Business Model Canvas is a disciplined process, not an act of desperation. It requires a willingness to let go of assumptions and embrace what the data tells you. By systematically analyzing market signals and adjusting the nine building blocks, you align your strategy with reality.
Remember that the canvas is a living document. It should be updated regularly as new data comes in. This agility is the defining characteristic of modern, successful ventures. Start gathering your data today, identify the signals, and be prepared to adjust your path when the evidence demands it.
Your business model is your hypothesis. Market data is your test. The pivot is your conclusion. Keep the cycle moving, and you will build a resilient organization capable of thriving in any environment.
🔑 Key Takeaways
- Data drives the decision to pivot, reducing reliance on intuition.
- Identify specific signals like stagnation or high churn before changing the model.
- Modify specific blocks of the canvas rather than making vague changes.
- Validate every pivot with a new set of metrics and tests.
- Communicate the “why” clearly to maintain team alignment.

