Investors do not fund ideas; they fund traction and validated growth. The most critical metric in early-stage venture capital is Product Market Fit (PMF). It signals that a solution addresses a genuine need within a specific market segment. However, articulating this fit requires more than anecdotal evidence. It demands a structured approach that aligns with the strategic framework of the Business Model Canvas (BMC).
When presenting to stakeholders, the narrative must shift from “what we built” to “what the market is telling us.” This guide outlines how to leverage the BMC to construct a compelling case for PMF. We will break down each building block of the canvas, mapping it to specific evidence investors require.
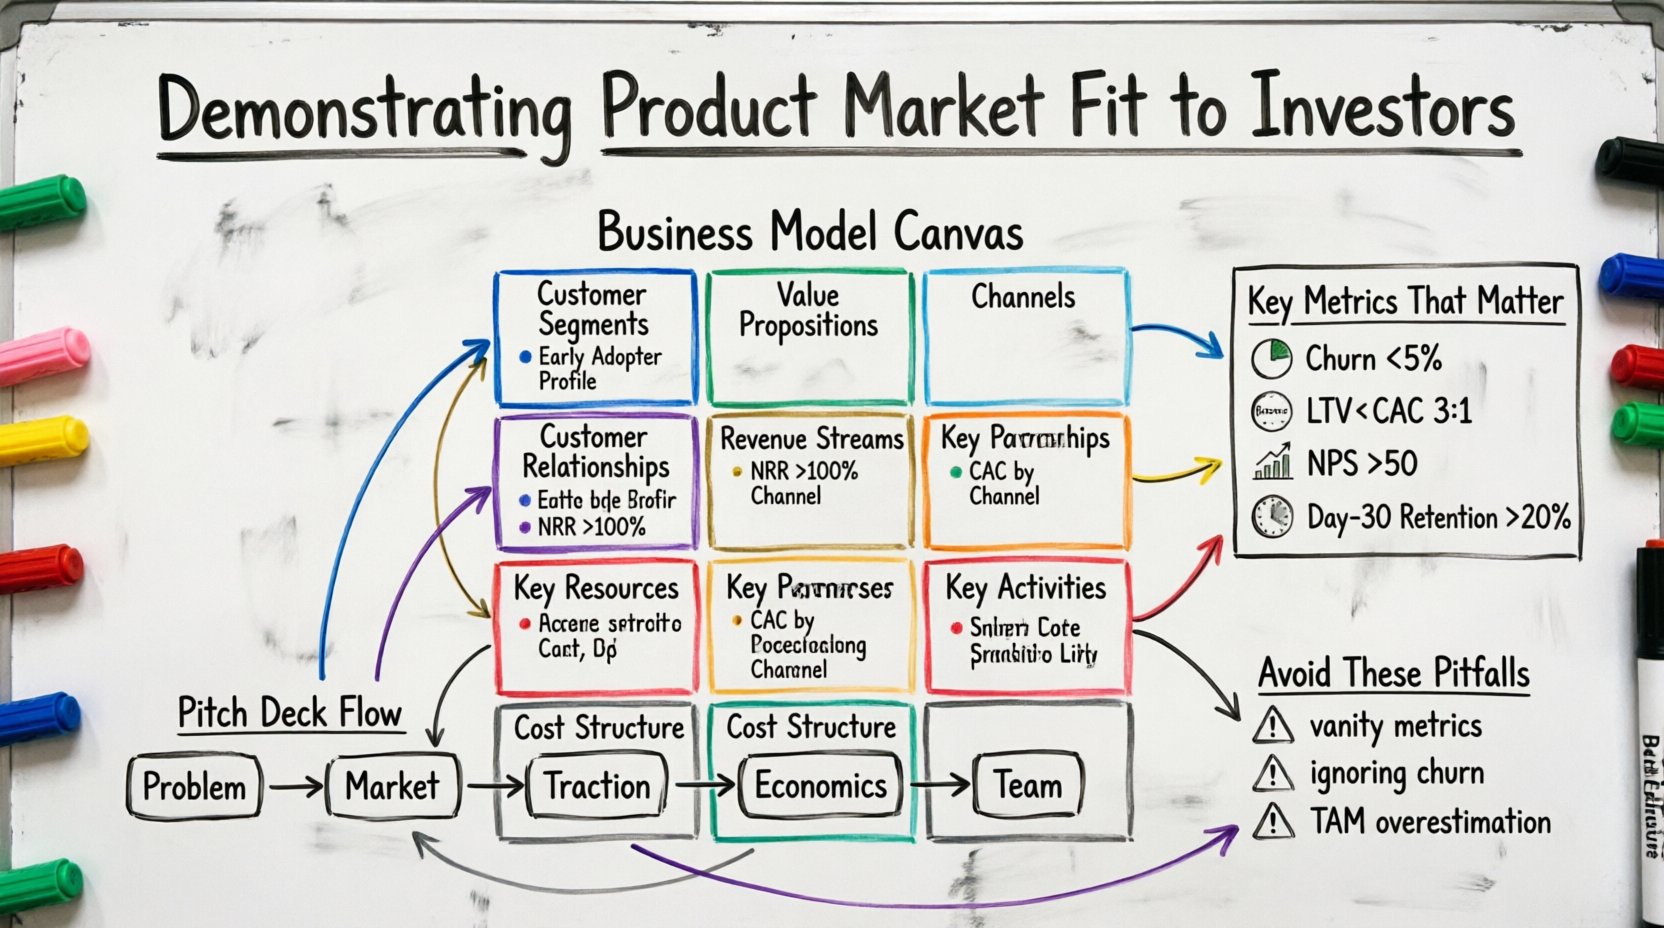
🎯 Defining the Connection Between BMC and PMF
The Business Model Canvas is often viewed as a static planning tool. In the context of fundraising, it serves as a dynamic dashboard of validation. Investors scan this canvas looking for coherence between your value proposition and the actual behavior of your customers.
- Coherence: Does the channel you use match the customer segment you target?
- Validation: Are the revenue streams supported by the value proposition?
- Sustainability: Is the cost structure aligned with the efficiency of the delivery?
PMF is not a destination; it is a state of evidence. When an investor looks at your BMC, they are asking: “Can you scale this model without breaking it?” Your presentation must answer this by showing historical data and projected efficiency.
🏗️ The BMC Blocks as Evidence of Fit
Each of the nine building blocks of the Business Model Canvas offers a unique opportunity to demonstrate market validation. Below, we detail how to translate each block into investor-grade evidence.
1. Customer Segments: Who Actually Pays?
Investors are skeptical of “everyone” as a target audience. To show PMF, you must demonstrate a distinct segment that has adopted your product. This requires granular data.
- Early Adopter Profile: Define the specific characteristics of the users who buy first. Are they small businesses in a specific region? Is it a specific demographic within a larger industry?
- Adoption Rates: Show conversion rates specific to this segment compared to others. High conversion in a niche indicates strong fit.
- Retention Cohorts: Show that this specific segment returns. Churn rates for the core segment should be significantly lower than the general user base.
2. Value Propositions: Solving the Right Problem
A value proposition is only valid if the market acknowledges the value. Investors look for proof that your solution is a “must-have” rather than a “nice-to-have”.
- Problem-Solution Fit: Cite specific feedback where customers explicitly stated the problem was critical before they tried your solution.
- Competitive Differentiation: Avoid generic claims. Show data comparing your solution to alternatives. If you are 20% cheaper, 50% faster, or 100% more accurate, quantify it.
- Feature Adoption: Which features are used most? High usage of core features indicates the value proposition is resonating.
3. Channels: How You Reach the Market
The efficiency of your acquisition channels directly impacts the unit economics of your business. Investors want to see that you understand the cost to acquire a customer relative to the value they bring.
- Acquisition Cost (CAC): Break down costs by channel. Organic, paid, referral, or direct sales.
- Channel Efficiency: Demonstrate that the channel you are scaling is the one with the highest conversion and lowest cost.
- Feedback Loops: How does this channel facilitate feedback? Direct sales might yield high-quality feedback, while automated channels might yield scale.
4. Customer Relationships: Engagement and Trust
How you interact with customers affects lifetime value. A high-touch relationship might be necessary for enterprise deals, while self-serve might work for SMBs.
- Support Metrics: Ticket volume, resolution time, and satisfaction scores (CSAT).
- Community Engagement: Active forums, user groups, or social media interactions indicate a strong bond.
- Onboarding Success: Time to value. How quickly does a new user achieve the core benefit?
5. Revenue Streams: The Truth in Numbers
This is the most scrutinized part of the canvas. Revenue must be recurring, predictable, and growing. Investors analyze the quality of revenue, not just the quantity.
- Recurring Revenue: Monthly Recurring Revenue (MRR) or Annual Recurring Revenue (ARR) are standard benchmarks.
- Net Revenue Retention (NRR): Does revenue grow from existing customers through upsells and cross-sells? NRR above 100% is a strong signal of PMF.
- Pricing Power: Evidence that you can raise prices without significant churn indicates strong market fit.
6. Key Resources: What You Own That Matters
Investors assess the defensibility of your model. What assets do you control that make it hard for others to copy?
- Data Assets: Proprietary data that improves the product over time.
- Intellectual Property: Patents, trademarks, or unique algorithms.
- Talent: A team with specific domain expertise that competitors lack.
7. Key Activities: What You Must Do Well
This block defines the operational engine. Investors want to know if the activities driving growth are scalable.
- Development Velocity: How fast are you iterating based on market feedback?
- Quality Assurance: Measures taken to ensure stability as scale increases.
- Customer Success: Active efforts to ensure users achieve their goals.
8. Key Partnerships: Leveraging External Strengths
Strategic alliances can accelerate PMF. However, investors look for partnerships that provide value, not just vanity metrics.
- Integration Partners: Tools that integrate with yours increase stickiness.
- Distribution Partners: Access to new audiences without direct acquisition costs.
- Supply Chain: Reliability of vendors affecting product delivery.
9. Cost Structure: Efficiency and Scalability
High burn rates with low growth are a red flag. A healthy cost structure supports the revenue model.
- Fixed vs. Variable Costs: A model with high fixed costs requires high volume to be profitable. Variable costs should scale linearly with revenue.
- Operating Leverage: Evidence that costs do not increase as fast as revenue.
- Runway: How long can you operate at current burn rates? Investors calculate this based on your cash position and burn rate.
📈 Structuring the Pitch Deck with BMC Data
Organizing the information within a pitch deck requires translating the BMC blocks into a narrative flow. Investors typically spend minutes on a deck, so every slide must serve a purpose.
Consider this structure for your presentation:
- Slide 1: The Problem & Solution. (Linked to Value Proposition).
- Slide 2: Market Size & Segments. (Linked to Customer Segments).
- Slide 3: Traction & Metrics. (Linked to Revenue Streams & Channels).
- Slide 4: Business Model Economics. (Linked to Cost Structure & Key Resources).
- Slide 5: The Team & Ask. (Linked to Key Activities & Partners).
Ensure the metrics on Slide 3 directly support the claims made in Slide 1. If you claim a massive problem, the traction must show a growing solution adoption.
📉 The Metrics That Matter Most
While the BMC provides the structure, the numbers provide the proof. Investors focus on a specific set of metrics to validate the canvas. Below is a table of critical metrics and what they signify regarding PMF.
| Metric | Why It Matters | Target Benchmark |
|---|---|---|
| Churn Rate | Indicates customer dissatisfaction or lack of fit. | < 5% Monthly (SaaS) |
| LTV:CAC Ratio | Measures profitability of customer acquisition. | 3:1 or higher |
| Monthly Active Users (MAU) | Shows engagement and stickiness. | Growing MoM |
| Net Promoter Score (NPS) | Measures willingness to recommend. | > 50 |
| Day 30 Retention | Tests if users find long-term value. | > 20% |
| Burn Multiple | Measures capital efficiency. | < 2.0x |
⚠️ Common Pitfalls in Demonstrating Fit
Even with strong data, founders often misinterpret signals. Avoid these common mistakes when presenting your case.
- Focusing on Vanity Metrics: Total sign-ups look good, but active users tell the truth. Investors ignore total registrations if daily active users are flat.
- Ignoring Negative Feedback: Do not hide churn. Explain why it happened and what you changed. Transparency builds trust.
- Overestimating Market Size: Do not use “TAM” (Total Addressable Market) to justify PMF. PMF is about the specific segment you currently serve. Start with the SAM (Serviceable Available Market).
- Confusing Interest with Revenue: Waiting lists and emails are not revenue. Show actual cash flow or committed contracts.
- Assuming One Model Fits All: Do not apply a B2C model to a B2B pitch. The metrics and sales cycles differ significantly.
🔍 How to Validate the “Fit” Before the Meeting
Before walking into a room, ensure your internal data supports the narrative. Conduct a self-audit of your Business Model Canvas.
- Review Retention Curves: If the curve flattens quickly, you have fit. If it drops to zero, you do not.
- Analyze Referral Sources: Are users coming from word-of-mouth? This is the strongest signal of organic fit.
- Check Price Sensitivity: Have you tested different price points? Willingness to pay at a higher price indicates strong value.
- Survey Users: Ask users why they would be very disappointed without your product. If more than 40% say yes, you have PMF.
- Verify Unit Economics: Ensure every customer adds to the bottom line over time, not just the top line.
🤝 The Human Element: Storytelling with Data
Numbers alone do not win funding. You must weave the data into a story about the problem you are solving. The BMC provides the skeleton; the story provides the flesh.
- Start with the User: Begin with a specific customer story that illustrates the problem.
- Connect to the Data: Use the BMC metrics to show this story is repeatable and scalable.
- End with the Vision: Show where the canvas goes next. How does the market expand as you scale?
Investors bet on people as much as products. Your confidence in the data should reflect your confidence in the team.
🛠️ Preparing for Due Diligence
Once the initial interest is piqued, investors will dig deeper. Your BMC should be backed by a data room containing the raw evidence.
- Financial Statements: P&L, balance sheets, and cash flow statements.
- Customer Contracts: Copies of signed agreements to validate revenue claims.
- Product Analytics: Screenshots or exports from your analytics tools showing usage patterns.
- Technical Documentation: Architecture diagrams showing how the system scales.
Ensure the numbers in the pitch deck match the numbers in the data room. Discrepancies here can kill a deal immediately.
🚀 Scaling the Model
Once PMF is proven, the focus shifts to scaling. The BMC changes as you grow. New customer segments emerge. Channels diversify. Costs shift.
- Revisit the Canvas: Every 6 months, update the BMC to reflect current realities.
- Identify Bottlenecks: Which block is limiting growth? Is it sales capacity (Key Activities) or funding (Cost Structure)?
- Adjust the Strategy: If a channel stops working, shift resources to the next best option.
Investors want to know you can adapt. The initial PMF is just the foundation for a larger structure.
📝 Summary of Key Takeaways
- PMF is Evidence: It is not a feeling. It is a collection of metrics and behaviors.
- BMC is the Map: Use the nine blocks to organize your evidence logically.
- Metrics Drive Trust: Focus on retention, LTV, and NRR over vanity metrics.
- Transparency Wins: Acknowledge weaknesses and show how you plan to fix them.
- Story Matters: Combine data with a compelling narrative about the user.
Presenting Product Market Fit is about clarity. It is about showing that the market has spoken and you have listened. By aligning your Business Model Canvas with hard data, you remove the guesswork from the investment decision. This approach respects the investor’s need for security while highlighting the founder’s vision for growth. The goal is not to convince them blindly, but to provide them with the information they need to see the opportunity for themselves.