When designing complex software systems, understanding the internal arrangement of components is just as critical as knowing how they interact externally. The Composite Structure Diagram (CSD) serves as a specialized tool within the Unified Modeling Language (UML) to visualize the internal structure of classifiers. It bridges the gap between high-level functional requirements and the concrete implementation details of parts and roles.
This guide provides a comprehensive look at how to translate abstract requirements into precise visual maps. We will explore the anatomy of the diagram, the process of mapping requirements, and the best practices for maintaining clarity throughout the development lifecycle.
🧩 Understanding the Composite Structure Diagram
A Composite Structure Diagram depicts the internal structure of a classifier. While a standard Class Diagram shows attributes and methods, the CSD reveals what makes up the class from the inside. It is essentially a structural blueprint that defines how internal parts collaborate to fulfill the responsibilities of the classifier.
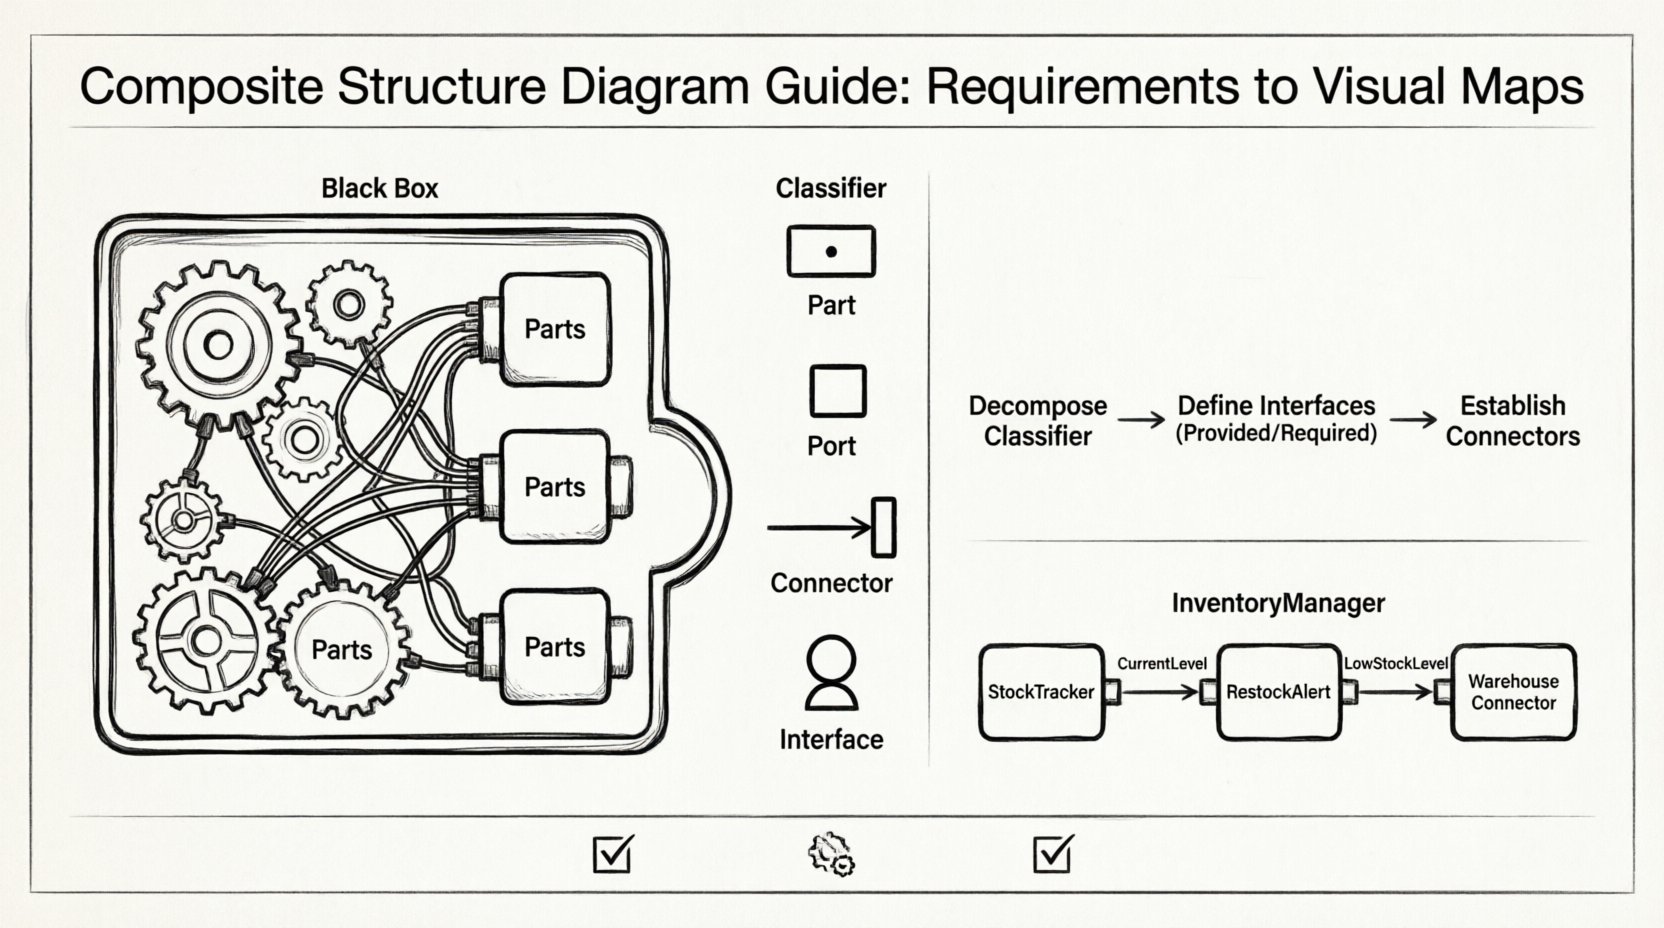
Think of it as looking inside a black box. You know what goes in and what comes out, but the CSD shows the gears, wires, and modules within. This level of detail is essential for architects who need to ensure that internal dependencies do not create bottlenecks or unintended coupling.
Why Use This Diagram?
- Internal Visibility: It exposes the internal composition of classes, which is hidden in standard class diagrams.
- Interface Clarity: It defines provided and required interfaces explicitly at the part level.
- Requirement Mapping: It allows direct tracing of system requirements to specific internal components.
- Reuse Identification: It helps identify reusable parts that can be deployed independently.
🔗 Translating Requirements into Visual Maps
The process of creating a Composite Structure Diagram begins with a clear set of requirements. These requirements often describe functionality (what the system does) and constraints (how the system must behave). The diagram translates these textual descriptions into structural relationships.
Step 1: Decompose the Classifier
Identify the main classifier (e.g., a PaymentProcessor class). Ask the following questions based on the requirements:
- What distinct parts are needed to process a payment?
- Are there separate modules for validation, logging, and transaction processing?
- Do these parts need to communicate with each other?
Based on the answers, define the Parts. Each part represents an instance of a classifier that exists within the composite structure.
Step 2: Define Interfaces
Parts do not usually interact directly. Instead, they interact via interfaces. Requirements often specify input and output conditions. Map these to interfaces:
- Provided Interfaces (Lollipop): What services does this part offer to other parts?
- Required Interfaces (Socket): What services does this part need from others?
For example, a PaymentValidator part might require a BankConnection interface to verify funds. This relationship must be explicitly drawn.
Step 3: Establish Connections
Connect the parts using Connectors. These represent the physical or logical links between the interfaces. The connectors show the flow of data and control within the system.
🛠️ Key Elements and Symbols
To create a valid diagram, you must understand the standard notation used in the Unified Modeling Language. The following elements form the backbone of the Composite Structure Diagram.
Partitions and Parts
A partition represents a compartment within the classifier. It holds the parts. Each part has a name and a type. The type defines the classifier that the part is an instance of.
- Part Name: A label for the specific instance (e.g.,
creditCardReader). - Type: The class it belongs to (e.g.,
CardReader). - Multiplicity: Indicates how many instances of the type exist within the part (e.g.,
1or0..*).
Ports
Ports are the points of interaction on a part. They define where a part connects to the outside world or other internal parts. Ports can be:
- Input Ports: Where signals enter the part.
- Output Ports: Where signals leave the part.
- Combined Ports: Where both inputs and outputs occur.
Connectors
Connectors link ports to other ports or to the classifier’s boundary. They represent the communication channel. There are two main types:
- Internal Connectors: Connect ports within the same composite structure.
- External Connectors: Connect ports to the classifier’s interface.
📊 Comparison of Diagram Elements
Understanding the distinction between similar UML elements is crucial for accurate modeling. The table below outlines the differences.
| Element | Function | Visual Symbol |
|---|---|---|
| Part | Represents a component instance within a composite. | Rectangle with a small filled circle at the top. |
| Port | Defines an interaction point on a part. | Small rectangle attached to the side of a part. |
| Connector | Links ports to define communication paths. | Line connecting two ports. |
| Interface | Defines a contract of operations (lollipop or socket). | Circle (lollipop) or Semi-circle (socket). |
🔄 Collaboration with Other Diagrams
The Composite Structure Diagram does not exist in isolation. It works in tandem with other UML diagrams to provide a complete picture of the system architecture.
Class Diagram Integration
The Class Diagram provides the static structure of the system. The CSD provides the dynamic internal composition. When you define a part in a CSD, that part must correspond to a class in the Class Diagram. This ensures consistency between the structural definition and the internal implementation.
Sequence Diagram Alignment
Sequence Diagrams show the flow of messages over time. The CSD provides the context for these messages. If a sequence diagram shows a message from Part A to Part B, the CSD must show the connector linking their ports. This alignment helps in validating the feasibility of the interaction.
Component Diagram Relationship
Component Diagrams focus on the system-level components. The CSD focuses on the internal structure of a specific classifier. You might have a Component Diagram showing a PaymentSystem component, and a CSD showing the internal parts of the PaymentProcessor class within that system.
⚠️ Common Pitfalls and Anti-Patterns
Creating these diagrams can be deceptively simple, but several common mistakes can lead to confusion and maintenance issues.
1. Over-Nesting
Do not nest parts within parts indefinitely. Deep nesting makes the diagram difficult to read. If a part requires significant internal structure, consider extracting it into a separate class or component.
2. Ignoring Multiplicity
Always specify the multiplicity of parts. Assuming a single instance when multiple are required leads to logical errors in the code. For example, a LogHandler might need to manage multiple LogFile parts simultaneously.
3. Mixing Responsibilities
Ensure that each part has a clear responsibility. If a part handles both data storage and user interface logic, it violates the Single Responsibility Principle. Split these concerns into separate parts with their own interfaces.
4. Inconsistent Interface Naming
Ensure that required interfaces match the provided interfaces exactly. Mismatched names create ambiguity and can lead to integration failures during development.
🛡️ Best Practices for Maintenance
Maintaining these diagrams is as important as creating them. As the system evolves, the internal structure may change. Follow these practices to keep the documentation accurate.
- Version Control: Treat diagrams as code. Store them in the same version control system as the source code.
- Review Cycles: Include diagram reviews in the sprint cycle. Ensure the visual map matches the current implementation.
- Automated Checks: Where possible, use tools that can verify the consistency between the CSD and the source code.
- Clear Naming Conventions: Adopt a strict naming convention for parts, ports, and interfaces to reduce cognitive load.
🌍 Real-World Application Example
Consider an Online Inventory System. The requirements state that the system must track stock levels across multiple warehouses and handle restocking alerts.
Step 1: Identify the Classifier
The main classifier is InventoryManager.
Step 2: Define Parts
Based on requirements, we define:
StockTracker: Monitors current levels.RestockAlert: Generates notifications.WarehouseConnector: Communicates with physical warehouse systems.
Step 3: Define Interfaces
StockTrackerprovidesCurrentLevelinterface.RestockAlertrequiresLowStockLevelinterface.WarehouseConnectorprovidesUpdateStockinterface.
Step 4: Connect
Connect the CurrentLevel output of StockTracker to the LowStockLevel input of RestockAlert. Connect RestockAlert to WarehouseConnector to trigger restocking.
This visual map allows developers to see exactly where the logic resides and how data flows between modules without reading the code itself.
📝 Summary of Translation Steps
To ensure you can consistently translate requirements into these diagrams, follow this checklist:
- Read Requirements: Identify functional blocks.
- Define Parts: Create instances for each block.
- Map Interfaces: Determine inputs and outputs for each part.
- Draw Connectors: Link the interfaces logically.
- Validate: Check against sequence diagrams for flow consistency.
- Document: Add comments to explain complex interactions.
🚀 Conclusion
The Composite Structure Diagram is a powerful tool for system architects and developers. It moves beyond simple class relationships to show the actual composition of a system. By translating requirements into visual component maps, teams can reduce ambiguity, improve communication, and ensure that the internal architecture supports the desired functionality.
Adopting this practice requires discipline and attention to detail, but the payoff is a system that is easier to understand, maintain, and extend. Use the elements, follow the best practices, and keep your diagrams synchronized with your code to achieve robust software architecture.