In the landscape of software architecture, visual modeling serves as the bridge between abstract requirements and concrete implementation. Among the various diagrams defined in the Unified Modeling Language (UML), the Composite Structure Diagram offers a unique perspective. It moves beyond the static relationships of classes to reveal the internal architecture of a classifier. For a software engineering student, grasping this diagram is essential for understanding how complex systems are composed of smaller, interacting units.
This guide provides a detailed examination of the Composite Structure Diagram. It covers the core elements, the logic behind their interactions, and the practical applications in system design. By the end of this reading, you will have a clear framework for modeling internal structures without relying on specific tools or vendors.
What is a Composite Structure Diagram? 🏗️
A Composite Structure Diagram depicts the internal structure of a classifier. It shows the parts that make up the classifier, how they are connected, and the interfaces they expose. While a Class Diagram illustrates the static structure of a system through classes and their relationships, the Composite Structure Diagram zooms in on a single class or component to show its internal composition.
Think of it as the blueprint for a single house, whereas a Class Diagram is the map of the entire neighborhood. This diagram is particularly useful when a class has significant internal complexity that cannot be adequately represented by simple attributes and methods.
Key Characteristics
- Internal Focus: It details what is inside a specific classifier.
- Composition: It visualizes how parts are assembled to form the whole.
- Interaction: It defines how these internal parts communicate with each other and the external environment.
- Flexibility: It applies to classes, components, nodes, and packages.
Core Elements of the Diagram 📐
To construct a valid Composite Structure Diagram, one must understand the specific notations and their meanings. Each element serves a distinct purpose in defining the internal logic and connectivity.
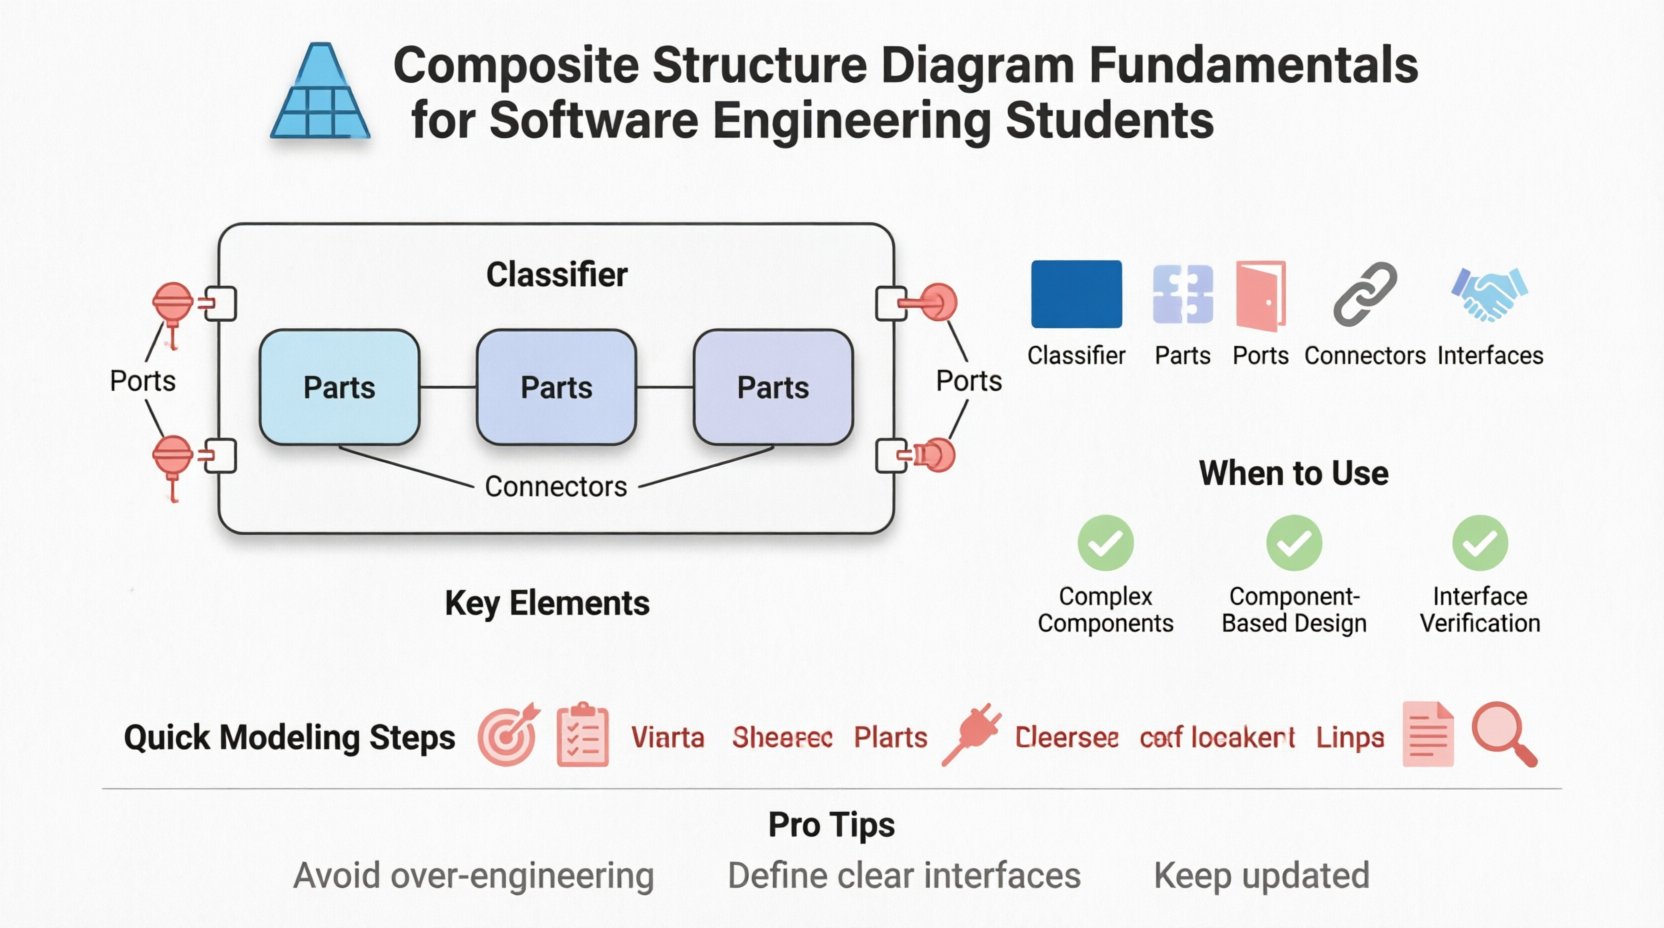
1. Classifier
The Classifier is the central element, often represented as a box. It acts as the container for the internal structure. In many cases, this is a specific Class from your domain model. The diagram is essentially a view of this classifier’s internals.
2. Parts
Parts represent the components that make up the classifier. They are instances of other classes or types that exist within the classifier’s boundary. Parts are depicted as rectangles with a specific icon indicating they are internal instances.
- Instance vs. Type: A part can be typed (referring to a class) or untyped (a generic instance).
- Multiplicity: A part can be singular or a collection (e.g., a list of listeners).
- Visibility: Like class attributes, parts can be public, private, or protected.
3. Ports
Ports are the interaction points of a classifier. They act as the surface through which parts communicate with the outside world or with each other. Ports encapsulate the internal details, ensuring that external interactions happen only through defined interfaces.
- Provided Interface: The functionality the part offers to the outside.
- Required Interface: The functionality the part needs from the outside.
4. Connectors
Connectors define the communication paths between parts or between ports and the outside environment. They represent the flow of data or control signals. Connectors ensure that the internal parts can function together as a cohesive unit.
- Internal Connectors: Link parts to each other within the classifier.
- External Connectors: Link parts to the environment or other classifiers.
5. Interfaces
Interfaces define the contract for interaction. In the context of this diagram, they are often shown as lollipop symbols (provided) or socket symbols (required). They ensure that the internal parts adhere to specific behavioral contracts.
Structuring Information: Element Comparison 📊
Understanding the differences between similar elements is crucial for accurate modeling. The table below clarifies the distinctions between Parts, Ports, and Connectors.
| Element | Function | Visual Representation |
|---|---|---|
| Part | Represents an internal instance of a class or type. | Rectangle with a small icon. |
| Port | Defines a point of interaction for the classifier. | Small square on the border of the classifier. |
| Connector | Establishes a link between ports or parts. | Line connecting two elements. |
| Interface | Specifies a set of operations. | Lollipop (provided) or Socket (required). |
When to Use This Diagram 🧩
Not every class requires a Composite Structure Diagram. Over-modeling can lead to unnecessary complexity. Use this diagram when the internal structure of a component is critical to understanding the system.
Appropriate Scenarios
- Complex Components: When a class is composed of many sub-components that interact significantly.
- Component-Based Design: When designing systems based on reusable components with defined interfaces.
- Deployment Context: When mapping software components to hardware nodes (often in conjunction with Deployment Diagrams).
- Interface Verification: When verifying that internal parts correctly implement the required interfaces.
When to Avoid
- Simple Classes: If a class has only a few attributes and methods, a Class Diagram is sufficient.
- Behavioral Logic: If the focus is on the flow of actions rather than structural composition, use a Sequence or Activity Diagram.
- High-Level Architecture: For system-level views, use Component or Deployment Diagrams instead.
Step-by-Step Modeling Process 🔗
Creating a Composite Structure Diagram involves a logical progression. Following a structured approach ensures consistency and clarity.
- Identify the Classifier: Select the class or component you wish to decompose.
- Define Internal Parts: List the sub-components that make up this classifier. Assign types and multiplicities.
- Establish Ports: Determine where external interaction occurs. Create ports for provided and required interfaces.
- Map Connections: Draw connectors between parts to show internal communication paths.
- Specify Interfaces: Define the contracts for each port to ensure type safety.
- Review and Refine: Check for consistency with other diagrams, such as the Class Diagram.
Differences from Class Diagrams 🔄
Students often confuse the Composite Structure Diagram with the Class Diagram. Both deal with structure, but their scope and granularity differ.
- Scope: Class Diagrams cover the entire system; Composite Structure Diagrams focus on a single classifier.
- Detail: Class Diagrams show attributes and operations; Composite Structure Diagrams show internal parts and their connections.
- Relationships: Class Diagrams use associations and inheritance; Composite Structure Diagrams use containment and connectors.
Design Patterns and Structural Integrity 🛡️
Applying design patterns within the context of a Composite Structure Diagram can enhance system maintainability. The diagram naturally supports patterns that rely on composition over inheritance.
Composition vs. Inheritance
While inheritance allows a class to derive behavior from a parent, composition allows a class to utilize behavior from other objects. The Composite Structure Diagram excels at visualizing composition.
- Flexibility: Changing a part does not necessarily change the classifier’s interface.
- Encapsulation: Parts remain hidden unless exposed through a port.
- Reusability: Parts can be shared across different classifiers if they expose standard interfaces.
Common Patterns
- Facade Pattern: A single port can simplify access to a complex subsystem of parts.
- Adapter Pattern: A part can translate an interface required by the classifier into an interface provided by another part.
- Bridge Pattern: Decouples an abstraction from its implementation through internal connectors.
Common Pitfalls to Avoid ⚠️
Mistakes in modeling can lead to confusion during implementation. Be mindful of these common errors.
- Over-Engineering: Do not model every internal variable as a part. Only model significant structural components.
- Missing Interfaces: Ensure all ports have defined interfaces. Unclear interfaces break the contract.
- Circular Dependencies: Avoid loops in connectors that could cause infinite recursion or deadlock.
- Inconsistency: Ensure the internal structure aligns with the public API defined in the Class Diagram.
Integration with Other Diagrams 🔍
A Composite Structure Diagram does not exist in isolation. It integrates with other UML diagrams to provide a complete picture of the system.
Sequence Diagrams
Use Sequence Diagrams to describe the dynamic behavior that occurs when messages pass through the ports defined in the Composite Structure Diagram. The static structure supports the dynamic flow.
Deployment Diagrams
Deployment Diagrams show where the classifiers are physically located. The Composite Structure Diagram shows what is inside the classifier. Together, they map logical architecture to physical infrastructure.
Component Diagrams
Component Diagrams operate at a higher level of abstraction. A component in a Component Diagram might be expanded into a Composite Structure Diagram to show its internal parts.
Best Practices for Maintenance 📝
Software systems evolve. The diagrams must evolve with them to remain useful.
- Keep it Updated: Modify the diagram whenever the internal structure changes significantly.
- Use Standard Notation: Stick to UML standards to ensure readability across different teams.
- Document Assumptions: Add notes if certain internal connections are implied rather than explicit.
- Modularize: Break large diagrams into smaller views if the classifier becomes too complex.
Conclusion on Utility
The Composite Structure Diagram provides a necessary level of detail for complex software engineering projects. It allows students and professionals to visualize the internal machinery of a component, ensuring that design decisions regarding composition and interaction are sound. By focusing on parts, ports, and connectors, this diagram clarifies how systems are built from smaller, manageable units.
Mastering the creation and interpretation of this diagram enhances one’s ability to design robust, maintainable, and scalable software architectures. It remains a vital tool in the structural modeling toolkit, bridging the gap between high-level design and low-level implementation.