In complex software engineering, the gap between high-level abstraction and tangible implementation often creates friction. Architects need a way to visualize how objects are composed of parts and how those parts interact internally. This is where the Composite Structure Diagram becomes essential. It goes beyond simple class relationships to show the internal wiring of a classifier.
This guide walks through a comprehensive case study. We will examine how an abstract model evolves into a functional system blueprint. We will look at the mechanics of parts, roles, connectors, and interfaces without referencing specific software tools. The goal is to understand the structural integrity of a system through rigorous modeling.
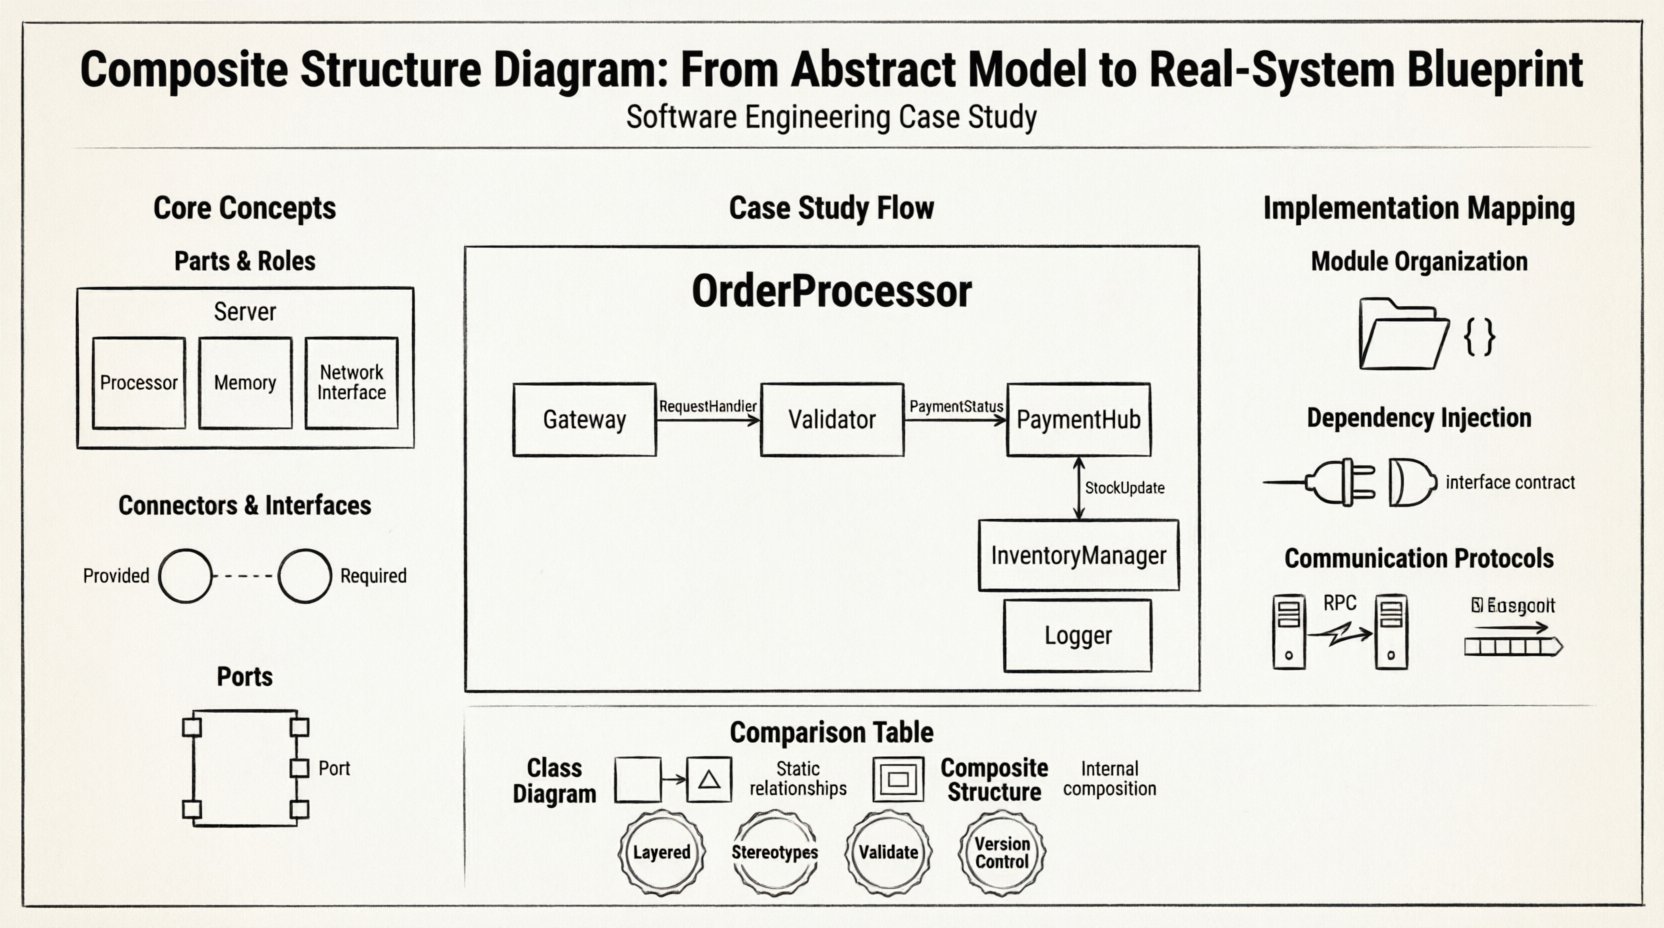
📐 Understanding the Core Concepts
Before diving into the case study, it is necessary to establish a firm grasp of the diagram’s components. Unlike a standard Class Diagram, which shows inheritance and association, the Composite Structure Diagram focuses on the internal arrangement of a classifier.
1. Parts and Roles
A classifier in this context is broken down into constituent parts. Each part is an instance of another classifier. For example, a Server classifier might contain parts like Processor, Memory, and NetworkInterface. These parts are assigned roles. A role defines the responsibility of a part within the context of the whole.
- Part: The specific instance or component within the structure.
- Role: The interface or behavior the part provides to the rest of the system.
2. Connectors and Interfaces
Parts do not exist in isolation. They must communicate. Connectors link the roles of different parts. Interfaces define the contract for this communication.
- Provided Interface: What a part offers to others.
- Required Interface: What a part needs from others to function.
3. Ports
Ports are the specific points of interaction on a part. They act as the physical or logical entry and exit points for data flow. Every interaction with an external element must pass through a port.
🏦 Case Study: Distributed Order Processing System
To illustrate the practical application, consider a financial transaction platform. The system handles customer orders, validates payments, updates inventory, and generates shipping manifests. The business requirement is high availability and modular scalability.
Phase 1: The Abstract Model
The initial design phase identifies the OrderProcessor as the primary classifier to be modeled. This is the black box that the rest of the system sees. However, for the engineering team to build it, the internal structure must be exposed.
The abstract model breaks the OrderProcessor down into the following key parts:
- Gateway: Handles incoming HTTP requests.
- Validator: Checks data integrity and business rules.
- PaymentHub: Manages external payment gateway connections.
- InventoryManager: Communicates with stock databases.
- Logger: Records all transaction events for auditing.
Each of these parts is a distinct software component. The Composite Structure Diagram maps how these parts fit together to form the single OrderProcessor unit.
🔗 Mapping Connections: The Real-System Blueprint
Once the parts are defined, the focus shifts to connectivity. This is where the diagram transitions from a static model to a dynamic blueprint. We must define the ports and interfaces for each part.
Defining Interfaces
Interfaces ensure loose coupling. If the PaymentHub changes its internal logic, the Validator should not break, provided the interface contract remains the same.
| Part Name | Provided Interface | Required Interface |
|---|---|---|
| Gateway | RequestHandler | ValidationService |
| Validator | ValidationResult | InventoryService |
| PaymentHub | PaymentStatus | NotificationService |
| InventoryManager | StockUpdate | DatabaseAccess |
Constructing the Connectors
Connectors bridge the gap between required and provided interfaces. In the blueprint, we define the flow of data.
- Request Flow: Gateway receives data. It connects to Validator’s required interface.
- Validation Flow: Validator processes data. It connects to InventoryManager’s required interface to check availability.
- Payment Flow: Validator connects to PaymentHub to process the transaction.
- Logging Flow: All parts connect to the Logger’s required interface to ensure no event is lost.
This structure prevents a single point of failure. If the Logger fails, the Gateway can still accept requests, though audit trails may be delayed. The diagram makes these dependencies visible immediately.
🛠️ Translation to Implementation
How does this diagram translate to code? The composite structure suggests a microservices or layered architecture pattern within the deployment container.
1. Module Organization
Each part in the diagram corresponds to a code module or namespace. The Gateway becomes a dedicated controller module. The Validator becomes a service layer. The physical directory structure mirrors the diagrammatic structure.
2. Dependency Injection
Ports and interfaces map directly to dependency injection patterns. The Gateway does not instantiate the Validator. It requests an instance that satisfies the ValidationService interface. This ensures the system remains flexible for testing and modification.
3. Communication Protocols
Connectors represent the communication protocol. Internal connections within a single process might use in-memory method calls. Connections between distinct parts deployed on different nodes use Remote Procedure Calls (RPC) or message queues. The diagram does not specify the protocol, but it dictates the need for one.
⚠️ Common Pitfalls in Modeling
Creating these diagrams is straightforward, but maintaining them requires discipline. Several common errors undermine the value of the model.
- Over-Engineering: Modeling every single variable creates noise. Focus on structural components that impact system behavior, not data attributes.
- Ignoring Lifecycle: Parts have lifecycles. A
DatabaseConnectionpart must be created before theQueryProcessoruses it and closed when the transaction ends. The diagram should indicate lifecycle constraints if critical. - Missing Interfaces: Connecting parts directly without an interface creates tight coupling. This makes refactoring difficult. Always define a contract first.
- Circular Dependencies: If Part A requires Part B, and Part B requires Part A, the system cannot initialize. The diagram helps visualize these loops early.
📊 Comparison: Class Diagram vs. Composite Structure Diagram
Understanding when to use which diagram is crucial for effective documentation.
| Feature | Class Diagram | Composite Structure Diagram |
|---|---|---|
| Focus | Static relationships between classes | Internal composition of a single classifier |
| Detail Level | High-level attributes and methods | Low-level parts, ports, and connectors |
| Best Used For | Domain modeling and database schema | Architecture design and deployment topology |
| Complexity | Can become large quickly | Scoped to specific components |
🚀 Best Practices for Structural Integrity
To ensure the blueprint remains useful throughout the project lifecycle, adhere to these guidelines.
1. Keep it Layered
Do not mix concerns. The presentation layer should not appear in the same diagram as the data persistence layer. Group parts by their functional responsibility. If a diagram becomes too crowded, it has failed its purpose.
2. Use Stereotypes
When describing parts, use stereotypes to indicate their nature. For example, a <<Singleton>> part ensures only one instance exists. A <<Stateless>> part indicates it holds no data between requests. This adds semantic meaning without cluttering the visual.
3. Validate Against Constraints
Before implementation begins, validate the diagram against non-functional requirements. Does the structure support the required throughput? Can the parts scale independently? If the diagram shows a single bottleneck, the blueprint is flawed regardless of the logic.
4. Version Control the Model
The diagram is a living document. As the system evolves, the composite structure changes. Treat the diagram with the same version control discipline as the source code. Document what changed and why.
🔍 Deep Dive: The Gateway Component
Let us examine the Gateway part in greater detail to demonstrate the depth of analysis possible with this approach.
The Gateway is the entry point. In the diagram, it has one provided interface (RequestHandler) and multiple required interfaces.
- AuthenticationRequired: Connects to the security subsystem.
- RoutingRequired: Connects to the internal router.
- LoggingRequired: Connects to the audit subsystem.
This decomposition allows the engineering team to assign different developers to different sub-features. The security team works on the authentication port. The routing team works on the routing port. The integration is defined by the diagram.
Furthermore, the diagram helps identify security vulnerabilities. If the LoggingRequired interface is not secured, sensitive data might leak. The structural view forces the team to consider security at the component level, not just the application level.
🔄 Iterative Refinement Process
Building the blueprint is rarely a linear process. It involves iteration.
- Drafting: Create the initial structure based on requirements.
- Review: Stakeholders review the parts and interfaces for completeness.
- Gap Analysis: Identify missing interfaces or unconnected parts.
- Refinement: Adjust the structure to optimize performance or security.
- Finalization: Lock the structure for implementation.
During the refinement phase, you might discover that two parts can be merged. For instance, if the Validator and InventoryManager share too many internal data structures, they might be combined into a single part with internal sub-parts. The diagram allows you to visualize this consolidation clearly.
🧩 Conclusion on Structural Design
The Composite Structure Diagram serves as a critical bridge between abstract design and concrete reality. It forces architects to think about the internal composition of systems, not just the connections between them. By defining parts, roles, ports, and interfaces, teams can build systems that are modular, maintainable, and scalable.
While it requires upfront effort, the return on investment is significant. When issues arise in production, the diagram provides a map to locate the failure point quickly. It reduces the cognitive load on developers by clarifying boundaries and responsibilities.
Adopting this modeling technique ensures that the system blueprint remains accurate as the technology landscape evolves. It is a foundational tool for robust engineering.