Designing complex software systems requires more than just writing code; it demands a clear understanding of how different components communicate over time. A Unified Modeling Language (UML) Sequence Diagram serves as a critical artifact for this purpose. It visualizes interactions between objects or actors within a specific timeframe, offering a blueprint for behavior before implementation begins. This guide provides a detailed walkthrough of constructing a practical sequence diagram, focusing on clarity, accuracy, and maintainability.
🎯 Defining the Scope and Scenario
Before drawing a single line, the scope of the interaction must be defined. A sequence diagram is not a system overview; it is a story about a specific use case. Choosing the right scenario is vital for a useful artifact.
🛒 The Chosen Use Case: Secure Checkout Process
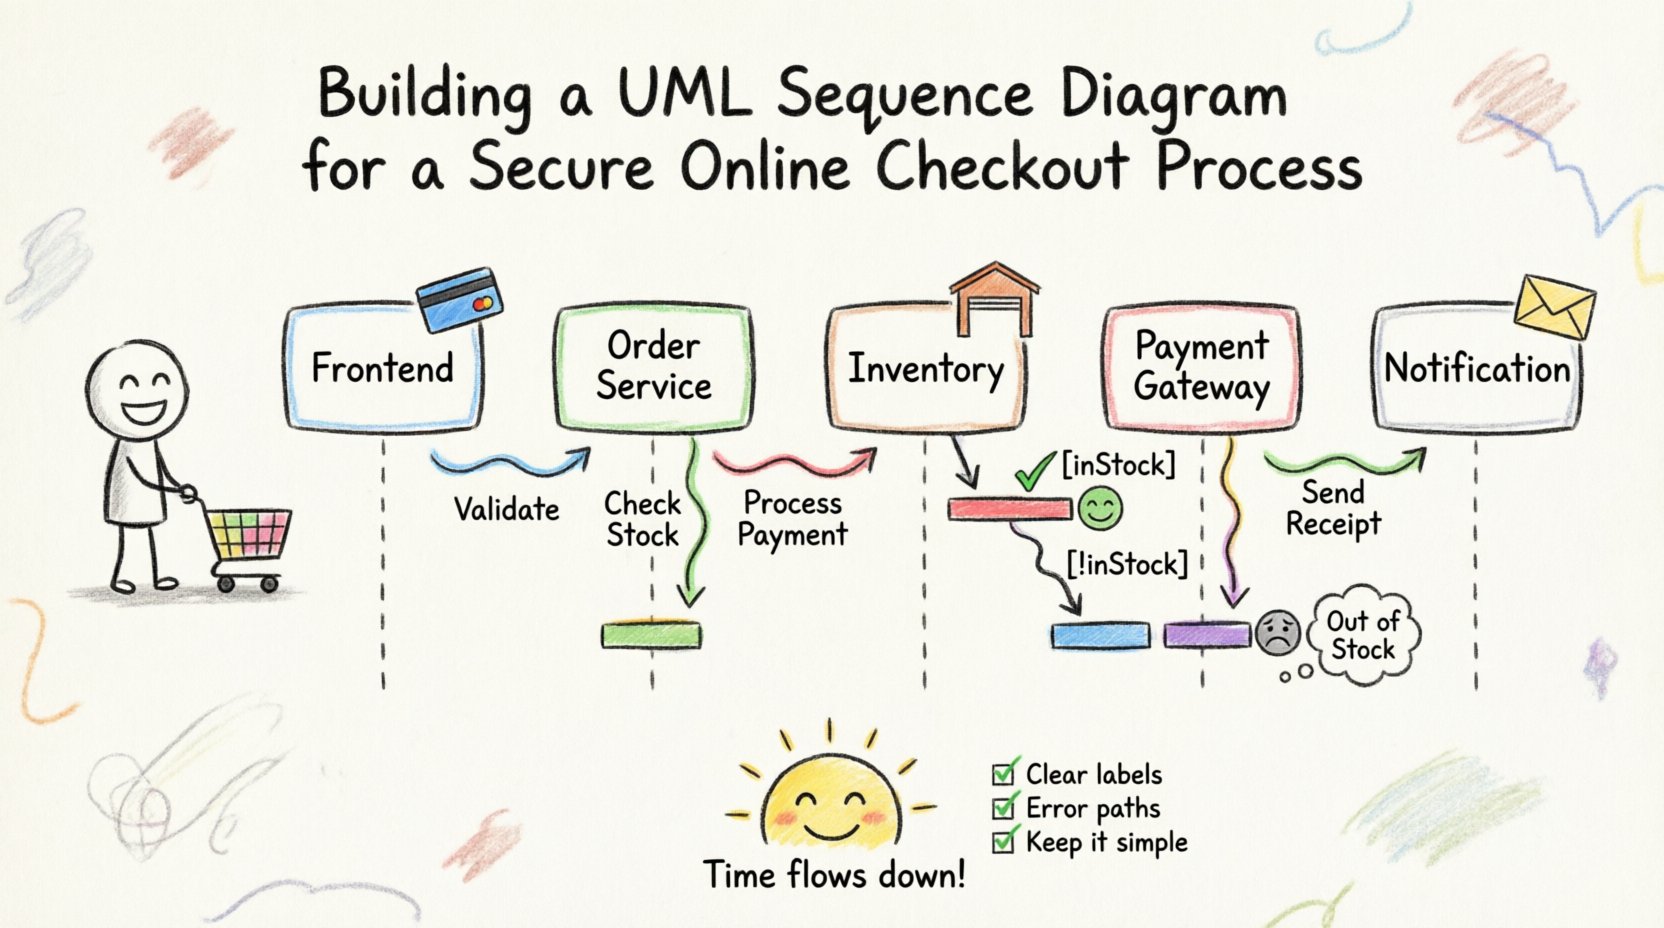
For this case study, we will model a secure checkout process for an online retail platform. This scenario is complex enough to demonstrate various diagram features but focused enough to remain readable. The goal is to trace the journey from the moment a customer clicks “Pay” to the final confirmation of the transaction.
Key objectives for this diagram include:
- Validation: Ensuring payment details are correct.
- Inventory Check: Verifying stock availability before charging.
- Notification: Sending confirmation emails to the user.
- Error Handling: Managing scenarios where the payment gateway fails.
👥 Step 1: Identifying Actors and Objects
The first technical step involves identifying the participants. In a sequence diagram, participants are represented as vertical lines called lifelines. These can be human actors or software objects.
🧑 The External Actor
Every interaction begins with a trigger. In this scenario, the trigger is the customer. We represent this using a standard stick figure icon. The customer initiates the process, but we do not model their internal thoughts; only their actions that interact with the system.
🖥️ The Internal Objects
Next, we identify the system components involved. To keep the diagram manageable, we group responsibilities logically:
- Frontend Application: The interface the customer sees. It collects input and displays results.
- Order Service: Manages the logic of creating an order record.
- Payment Gateway: An external system responsible for processing money.
- Inventory Service: Checks stock levels and reserves items.
- Notification Service: Handles email delivery.
Each of these objects gets a vertical lifeline descending from the top of the diagram. It is crucial to order these lifelines logically, typically placing the initiator on the far left and dependent systems on the right.
📉 Step 2: Establishing Lifelines and Activation Bars
Once the participants are placed, we draw vertical dashed lines down the page. These are lifelines. They represent the existence of the object during the interaction. At the top of each line, we place the object name and its type (e.g., Customer, OrderService).
Activation Bars: To indicate when an object is actively performing a task, we draw a narrow rectangle over the lifeline. This is known as an activation bar. It helps readers understand when an object is busy and cannot handle other requests immediately.
📊 Table: Lifecycle Elements
| Element | Visual Representation | Purpose |
|---|---|---|
| Lifeline | Vertical Dashed Line | Shows the participant’s existence over time. |
| Activation Bar | Rectangular Box on Lifeline | Indicates active processing or control. |
| Message Arrow | Horizontal Arrow | Shows communication between participants. |
| Return Message | Dashed Arrow | Indicates a response or data return. |
💬 Step 3: Mapping Messages and Interactions
The core of the sequence diagram is the flow of messages. Messages represent method calls or signals sent between objects. We draw these as horizontal arrows connecting the lifelines. The direction of the arrow indicates the sender and receiver.
🔗 Synchronous vs. Asynchronous Messages
Understanding the timing of messages is essential for accurate modeling.
- Synchronous: The sender waits for a response before continuing. Visually, this is a solid line with a filled arrowhead. For example, when the Frontend asks the Order Service to create an order, it waits for the confirmation.
- Asynchronous: The sender sends a message and continues without waiting. Visually, this is a solid line with an open arrowhead. An example is the Notification Service sending a background log entry to the Audit Service.
Constructing the Flow:
- Initiation: The Customer sends a Request Payment message to the Frontend Application.
- Validation: The Frontend sends a Validate Details message to the Order Service.
- Inventory Check: The Order Service sends a Check Stock message to the Inventory Service.
- Processing: Upon stock confirmation, the Order Service sends a Process Transaction message to the Payment Gateway.
- Confirmation: The Payment Gateway returns a Success message to the Order Service.
- Completion: The Order Service sends a Create Order message to the Database.
- Notification: The Order Service triggers a Send Receipt message to the Notification Service.
Each arrow should be labeled clearly with the message name. This labeling is what transforms a sketch into a specification document.
🧠 Step 4: Handling Logic Branches (Alt and Opt)
Real-world systems rarely follow a single perfect path. Error handling and conditional logic are critical components of a robust sequence diagram. UML provides interaction fragments to model these scenarios.
🔀 The Alt Fragment (Alternative)
The Alt fragment represents an if-else structure. It divides the diagram into sections based on a condition. If the condition is true, one path is taken; if false, another is taken.
In our checkout scenario, we use an Alt fragment when checking inventory:
- Condition [inStock]: If items are available, proceed to payment.
- Condition [!inStock]: If items are unavailable, trigger an out-of-stock alert to the customer.
Visually, this is drawn as a dashed box surrounding the alternative paths, with the condition labeled at the top of each section.
🔁 The Loop Fragment
If a process repeats, use a Loop fragment. While less common in a simple checkout, imagine a scenario where a customer has multiple items in their cart. The system might loop through each item to verify stock individually. This keeps the diagram clean rather than drawing the same sequence repeatedly.
⏳ Step 5: Representing Time and Execution
Time flows from top to bottom in a sequence diagram. This vertical axis is implicit but powerful. The vertical distance between messages often represents the passage of time or network latency.
🚀 Activation and Deactivation
When an object sends a message, its activation bar begins. When it receives a return message, the activation bar ends. This visual cue helps identify bottlenecks. If a single activation bar is extremely long, it indicates a heavy computation or a slow external dependency.
Example Scenario:
If the Payment Gateway takes 5 seconds to respond, the activation bar for the Order Service will extend vertically during that wait. This is valuable information for architects who need to optimize system responsiveness.
🔍 Step 6: Review and Refinement
Once the draft diagram is complete, a review process is necessary to ensure accuracy. A diagram that is too complex is useless, while one that is too simple is misleading.
✅ Checklist for Validation
- Completeness: Does every message sent have a corresponding return path or reaction?
- Clarity: Are all message names descriptive? Avoid generic terms like “Do it”.
- Consistency: Are lifelines aligned properly? Do the arrows cross unnecessarily?
- Readability: Is the logical flow easy to follow from top to bottom?
🔄 Iterative Improvement
Sequence diagrams are rarely perfect on the first attempt. It is common to move lifelines around to reduce crossing arrows. You might group related interactions to make the logic clearer. If a section is too crowded, consider splitting it into a higher-level diagram and a detailed sub-diagram.
🚫 Common Pitfalls to Avoid
Even experienced modelers make mistakes. Being aware of common errors saves time during development and documentation.
- Overloading Lifelines: Do not put unrelated processes on the same lifeline. Keep objects focused on their specific responsibilities.
- Ignoring State: A sequence diagram shows behavior, not state. Do not use it to explain object properties like “balance” or “status” unless it directly impacts the message flow.
- Missing Error Paths: Many diagrams only show the “Happy Path.” Always model what happens when a service is down or input is invalid.
- Too Much Detail: Do not model database queries for every field. If the Frontend calls Get User Data, do not diagram the SQL query unless it is the focus of the study.
- Static Information: Do not use sequence diagrams to explain static class structures. Use Class Diagrams for that purpose.
📋 Table: Message Types Reference
| Type | Arrow Style | Behavior | Example |
|---|---|---|---|
| Simple Call | Solid Line, Filled Head | Wait for response. | Order() |
| Asynchronous | Solid Line, Open Head | Fire and forget. | LogEvent() |
| Return | Dashed Line, Open Head | Response data. | OrderID |
| Self-Call | Curved Arrow | Object calls itself. | CalculateTax() |
🛠️ Maintenance and Documentation Strategy
A sequence diagram is a living document. As the system evolves, the diagram must be updated. Stale documentation is worse than no documentation because it misleads developers.
📅 Integration with Development Cycles
Integrate diagram reviews into the sprint planning phase. When a new feature is added, update the sequence diagram to reflect the new interaction paths. This ensures that the documentation remains synchronized with the codebase.
🔗 Linking to Code
If possible, link the diagram elements to the actual code repositories. While not always feasible, referencing the specific method names in the codebase helps developers locate the implementation quickly.
🤝 Collaboration and Team Alignment
One of the greatest values of a sequence diagram is its ability to align teams. Developers, testers, and business analysts can all look at the same visual representation and agree on the behavior.
🗣️ Facilitating Discussions
During meetings, use the diagram to point out gaps in logic. Ask questions like:
- What happens if the network drops during the payment step?
- How do we handle retries?
- Is the timeout value defined for this message?
This collaborative approach reduces ambiguity and prevents costly rework later in the development cycle.
🏁 Final Thoughts on Modeling
Building a UML Sequence Diagram is a disciplined exercise in communication. It forces you to think about the system as a series of interactions rather than isolated blocks of code. By following a structured approach—defining scope, identifying actors, mapping messages, and handling logic—you create a valuable resource for your team.
Remember that the goal is clarity. A diagram that takes too long to understand fails its purpose. Keep it clean, keep it accurate, and keep it updated. This commitment to visual documentation pays dividends in system stability and team efficiency.
As you continue to model, focus on the flow of control and the exchange of information. These diagrams become the shared language of your architecture, bridging the gap between business requirements and technical implementation.