Designing a database schema is rarely a binary choice between speed and structure. It is an exercise in compromise. When architects construct Entity-Relationship Diagrams (ERDs), they often face the tension between strict data integrity and the raw speed required for high-volume applications. Normalization minimizes redundancy, ensuring that data remains consistent. However, the cost of maintaining that consistency is often paid in read performance.
This article explores the technical nuances of this balance. We will examine how normalization impacts joins, how read-heavy workloads dictate schema changes, and where the line is drawn between a well-structured database and a performant one.
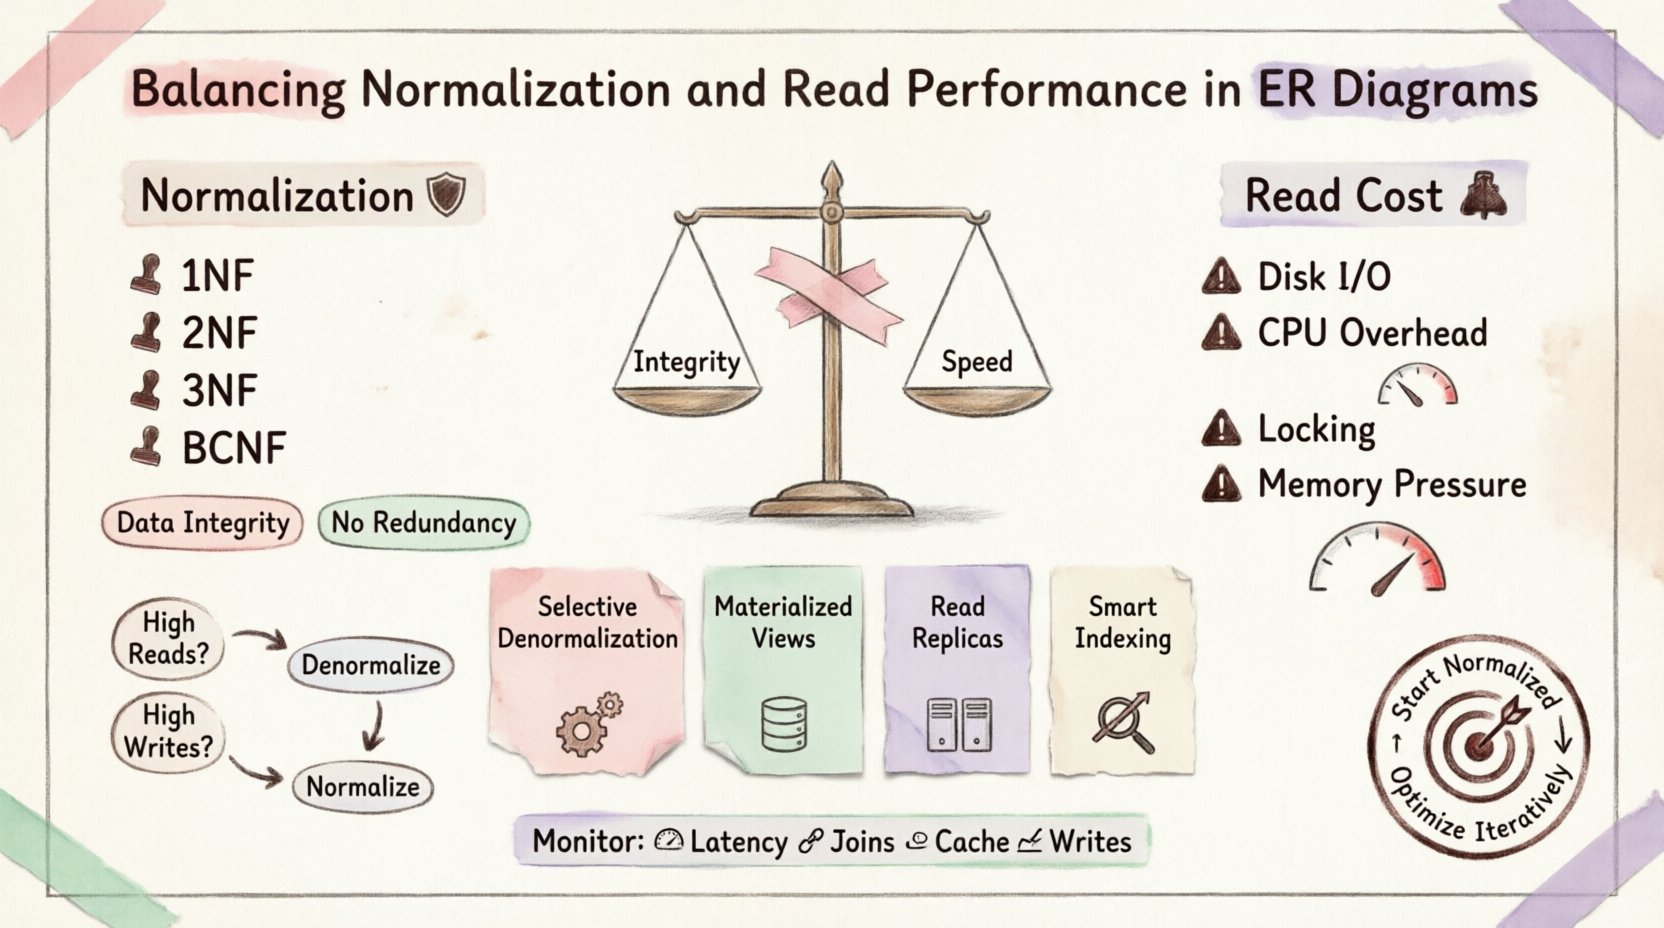
Understanding Normalization: The Foundation 🛡️
Normalization is the process of organizing data to reduce redundancy and improve data integrity. It involves dividing large tables into smaller, logical ones and defining relationships between them. The goal is to eliminate anomalies during insertion, update, and deletion.
Key Normal Forms
First Normal Form (1NF): Ensures atomicity. Each column contains only one value. No repeating groups.
Second Normal Form (2NF): Builds on 1NF. All non-key attributes must be fully dependent on the primary key. Removes partial dependencies.
Third Normal Form (3NF): Builds on 2NF. Removes transitive dependencies. Non-key attributes depend only on the key, the whole key, and nothing but the key.
Boyce-Codd Normal Form (BCNF): A stricter version of 3NF to handle specific dependency anomalies.
While adhering to these forms guarantees a clean database, it introduces complexity in querying. Every relationship defined in the ER diagram becomes a potential join operation.
The Cost of Reads 💸
When you normalize data, you often split information across multiple tables. To retrieve a complete record, the database engine must perform join operations. Joins are computationally expensive.
Why Joins Slow Down Queries
Disk I/O: If tables are not perfectly indexed or cached, the engine must seek data across different physical locations on the disk.
CPU Overhead: The database must match keys from one table to another. This requires significant processing power.
Locking Contention: Complex joins can hold locks longer, blocking other transactions from accessing related data.
Memory Pressure: Large join operations require substantial memory buffers to sort and hash data.
In a read-heavy environment, such as a reporting dashboard or a public-facing API, this latency is unacceptable. Users expect instant feedback. A query that takes 100 milliseconds to return normalized data might take 10 milliseconds if denormalized.
Strategies for Optimization 🚀
To balance integrity and speed, architects employ specific patterns. These strategies allow you to keep the database normalized where it matters most while optimizing for reads where it counts.
1. Selective Denormalization
Not all tables need to be fully normalized. Identify the most frequently accessed data and store it redundantly. For example, if you frequently query user names alongside their order history, storing the user name directly in the orders table saves a join.
2. Materialized Views
A materialized view stores the result of a query physically on disk. It is essentially a pre-calculated table. When data changes, the view must be refreshed. This is ideal for complex aggregations that do not need real-time accuracy.
3. Read Replicas
Separate the read workload from the write workload. Direct all write operations to the primary database, which remains normalized. Direct all read operations to a replica. This allows the replica to be optimized differently, perhaps with more indexes or denormalized structures, without affecting transactional integrity.
4. Indexing Strategy
Even normalized databases can perform well with the right indexes. Covering indexes allow the database to satisfy a query using only the index, avoiding table lookups. Composite indexes can speed up joins on common foreign keys.
When to Denormalize 📉
Denormalization is a deliberate decision, not a default state. It should be made based on evidence from performance monitoring, not assumptions.
Scenario | Approach | Reasoning |
|---|---|---|
High Write Frequency | Keep Normalized | Updates are faster. Less redundancy to maintain. |
High Read Frequency | Consider Denormalization | Reduces joins. Faster retrieval times. |
Data Consistency Critical | Keep Normalized | Single source of truth prevents data drift. |
Reporting & Analytics | Denormalize | Aggregations are complex; pre-calculating helps. |
Scalability Needs | Hybrid Approach | Split services or use caching layers. |
The Trade-Off: Data Integrity vs Speed ⚙️
Every time you introduce redundancy, you risk data inconsistency. If a user changes their email address, but the email is stored in both the Users table and the Notifications table, one update might fail or be missed. This is known as an update anomaly.
To mitigate this, application logic must be robust. Triggers can enforce consistency, but they add complexity. Alternatively, design the schema so that denormalized data is derived and immutable, reducing the risk of divergence.
Handling Consistency
Application-Level Logic: Write code that updates all redundant copies atomically.
Database Triggers: Let the database enforce rules automatically. This keeps logic close to the data.
Eventual Consistency: Accept that data might be stale for a short period. Use background jobs to sync redundant data.
Monitoring and Maintenance 🔧
A static design does not account for changing usage patterns. What works today might bottleneck next year. Continuous monitoring is essential.
Key Metrics to Track
Query Latency: Monitor the time taken for critical read queries.
Join Count: Track the number of joins per complex query.
Cache Hit Ratio: If you use caching, check if it is effectively reducing database load.
Write Latency: Ensure that denormalization hasn’t slowed down writes too much.
Conclusion: A Contextual Decision 🎯
There is no universal standard for database design. The best ER diagram is the one that fits your specific workload. Normalization provides safety; denormalization provides speed. The goal is to find the equilibrium point.
Start with a normalized design to ensure data integrity. As performance bottlenecks emerge, identify the specific queries causing delays. Apply denormalization or caching only to those areas. This iterative approach prevents premature optimization and ensures the system remains maintainable over time.
Remember that technology evolves. New storage engines and query optimizers continue to reduce the cost of joins. Regularly review your schema against current capabilities. The balance shifts, and your design must shift with it.
By understanding the mechanics of normalization and the realities of read performance, you can build systems that are both robust and responsive. Focus on the data, not just the code.