When designing complex systems, visualizing the internal architecture is critical. The Composite Structure Diagram serves this purpose by illustrating how components are assembled and how they interact. However, even experienced practitioners often create diagrams that obscure rather than clarify. This guide addresses five specific errors that lead to confusion among technical and non-technical stakeholders alike.
A well-constructed diagram acts as a blueprint for development and a communication tool for business owners. When it fails, projects stall, requirements get misinterpreted, and technical debt accumulates. The following sections detail common pitfalls, their consequences, and the correct approach to ensure clarity.
📐 Understanding the Scope of Composite Structure Diagrams
A Composite Structure Diagram, often referred to as a class diagram with internal parts, shows the internal structure of a classifier. It reveals the parts that make up a system and the roles they play. Unlike a standard class diagram, this view focuses on the composition relationships and the interfaces exposed by internal components.
Stakeholders rely on these diagrams to understand:
- Modularity: How the system is broken down into manageable units.
- Dependencies: Which parts rely on which other parts.
- Interaction: How data flows between internal components.
- Boundaries: Where the system ends and external services begin.
When these elements are presented clearly, decision-making becomes faster. When they are cluttered, the diagram loses its value. The following mistakes represent the most common barriers to effective communication.
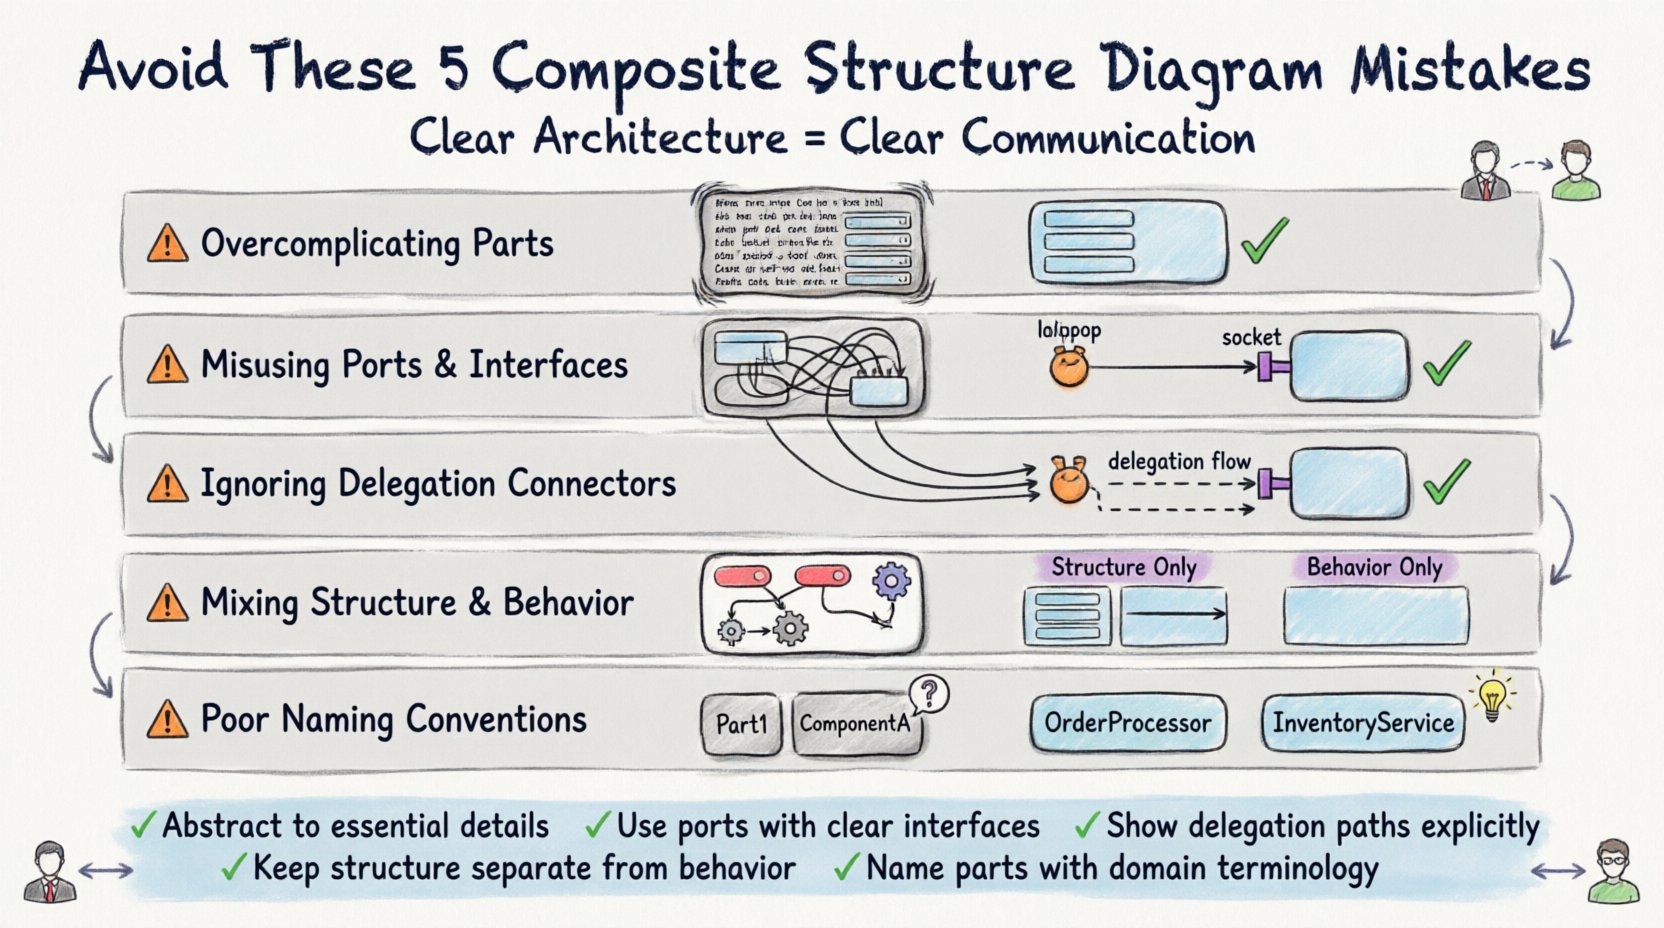
❌ Mistake 1: Overcomplicating Internal Parts
The most frequent error involves displaying too much detail within a composite structure. A common instinct is to show every attribute, method, and association inside a part. While comprehensive, this approach overwhelms the reader.
The Problem
When a single part contains a dense list of properties, the diagram becomes a wall of text. Stakeholders cannot distinguish between essential structural relationships and incidental implementation details. The diagram shifts from a high-level architectural view to a low-level specification document.
The Consequence
- Cognitive Overload: Readers struggle to find the main flow.
- Maintenance Burden: Diagrams become outdated quickly as implementation details change.
- Loss of Focus: The structural intent is lost in the noise of implementation specifics.
The Correction
Apply the principle of abstraction. Only include parts that are relevant to the specific context of the diagram. If a component is a simple data holder, represent it as a basic part without listing every field. Focus on the relationships between parts rather than the contents of the parts.
- Group related parts into sub-composites to reduce visual clutter.
- Use generalization to show shared structures rather than duplicating parts.
- Hide attributes unless they define the interface or behavior of the part.
❌ Mistake 2: Misusing Ports and Interfaces
Ports and interfaces define how parts interact with their environment. Misusing these elements leads to ambiguity regarding where connections should be made. This is a critical area where diagrams often fail to convey the actual contract of the component.
The Problem
Developers often draw connections directly between parts without using ports. Alternatively, they may create interfaces that do not match the actual operations provided by the part. This creates a disconnect between the visual model and the code.
The Consequence
- Implementation Errors: Developers may wire components incorrectly based on misleading diagrams.
- Integration Issues: External systems cannot find the correct entry points.
- Refactoring Risks: Changing an interface without updating the diagram breaks the model.
The Correction
Use ports to define the interaction points of a part. Ensure that every required interface is explicitly connected to a provided interface on a connected part. This visualizes the dependency clearly.
- Label ports clearly with the interface they implement.
- Use lollipop notation for provided interfaces and socket notation for required interfaces.
- Ensure the interface name matches the set of operations defined in the part.
❌ Mistake 3: Ignoring Lifelines and Delegation Connectors
In complex systems, communication often passes through an intermediate component. Ignoring how messages traverse these intermediaries is a significant oversight. Delegation connectors allow a part to delegate a request from its interface to a sub-part.
The Problem
Many diagrams show a request entering a composite and stopping there. They do not show where the request goes next. This hides the internal routing logic. Stakeholders see a black box rather than a transparent system.
The Consequence
- Hidden Complexity: The flow of control is opaque.
- Debugging Difficulty: Tracing issues becomes harder without clear paths.
- Performance Blindness: Bottlenecks inside the composite are invisible.
The Correction
Explicitly draw delegation connectors from the part’s port to the internal part that handles the request. This shows the path of execution.
- Map every external requirement to an internal capability.
- Use arrows to indicate the direction of the delegation.
- Annotate the connector if the logic involves filtering or transformation.
❌ Mistake 4: Mixing Structural and Behavioral Concerns
UML offers different diagram types for different concerns. The Composite Structure Diagram is for structure. State machines, sequence diagrams, and activity diagrams are for behavior. Mixing these into a single view creates confusion.
The Problem
Adding state transitions inside a part, or drawing message sequences within the structural layout, blurs the line between what the system is and what the system does. This violates the separation of concerns principle.
The Consequence
- Interpretation Errors: Readers confuse static structure with dynamic flow.
- Diagram Fatigue: The diagram becomes too complex to maintain.
- Tool Limitations: Some tools may not render mixed diagram types correctly.
The Correction
Keep the Composite Structure Diagram focused on composition and connections. If behavior is critical, link to a separate sequence or state diagram. Use the structure diagram to define the container for behavior, not the behavior itself.
- Reserve state diagrams for showing lifecycle changes.
- Reserve sequence diagrams for showing interaction flows.
- Use the Composite Structure Diagram to define the actors of those other diagrams.
❌ Mistake 5: Poor Naming Conventions for Parts and Roles
Names are the primary way humans read diagrams. Generic or inconsistent naming conventions destroy readability. Using terms like Part1, ComponentA, or Object1 provides no semantic value.
The Problem
When names lack context, stakeholders must guess the function of a component. This leads to miscommunication. For example, a part named Handler could be a UI handler, a network handler, or a database handler.
The Consequence
- Ambiguity: Multiple interpretations of the same diagram.
- Review Delays: More time spent asking questions during reviews.
- Knowledge Silos: Only the original designer understands the intent.
The Correction
Adopt a consistent naming strategy based on domain terminology. Use role names to describe how a part is used within the composite.
- Use domain-specific names (e.g., OrderProcessor instead of Part1).
- Label roles explicitly where a part plays a specific function (e.g., Client Role).
- Ensure naming matches the vocabulary used in business requirements.
📊 Comparison of Common Errors
The following table summarizes the mistakes and their impacts to help teams audit their own diagrams.
| Mistake | Visual Symptom | Impact on Stakeholders | Best Practice |
|---|---|---|---|
| Overcomplicating Parts | Dense lists of attributes inside boxes | Confusion about core relationships | Hide implementation details |
| Misusing Ports | Lines connecting directly between parts | Incorrect integration assumptions | Use ports and interface notation |
| Ignoring Lifelines | Dead ends in connections | Unclear data flow paths | Draw delegation connectors |
| Mixing Concerns | State icons inside structural boxes | Confusion between structure and flow | Use separate diagrams for behavior |
| Poor Naming | Generic labels like Part1 | Requires constant clarification | Use domain-specific terminology |
🗣️ The Impact on Project Communication
Diagrams are not just for engineers. They are the bridge between technical teams and business stakeholders. When a Composite Structure Diagram is confusing, the risk to the project increases significantly.
Business stakeholders need to understand the cost of complexity. If they cannot see how a system is built, they cannot estimate the effort required to change it. Technical stakeholders need to understand the constraints. If they cannot see the internal parts, they cannot design the interface correctly.
Key Communication Benefits of Clean Diagrams
- Alignment: Everyone agrees on the system boundaries.
- Speed: Onboarding new team members becomes faster.
- Accuracy: Development matches the architectural intent.
- Trust: Stakeholders trust the documentation when it is clear.
🔍 Practical Application Steps
To ensure your diagrams avoid these pitfalls, follow a structured review process before sharing them with the wider team.
Step 1: The Abstraction Check
Review every box. Can you remove any attributes or methods without losing the meaning? If yes, remove them. The goal is the lowest level of detail necessary to understand the structure.
Step 2: The Interface Check
Trace every line. Does it end at a port? Does the port match an interface? Are all required connections satisfied? If a line goes nowhere, it is a dangling dependency that needs correction.
Step 3: The Naming Check
Read the labels out loud. Do they sound like terms used in the business domain? If you have to explain what a part is called, the name is too technical or too vague.
Step 4: The Stakeholder Test
Show the diagram to someone who does not know the code. Ask them to explain the flow. If they stumble, the diagram is not ready. Simplify until they can explain it back to you.
🛠️ Maintaining Diagram Integrity
Once a diagram is created, it must be maintained. Software evolves, and so must the documentation. Neglecting updates leads to the “false document” problem, where the diagram is no longer accurate.
Integrate diagram updates into the development workflow. When a component is refactored, the Composite Structure Diagram should be updated alongside the code. This ensures the documentation remains a reliable source of truth.
Version control is also essential. Store diagram files alongside the code. This allows teams to track changes over time and revert if necessary. Automation tools can sometimes sync code changes to diagrams, but manual review is still required to ensure semantic accuracy.
📝 Summary of Key Takeaways
Creating effective Composite Structure Diagrams requires discipline. It is not enough to simply draw boxes and lines. The value lies in the clarity of the message conveyed.
By avoiding overcomplication, using ports correctly, showing lifelines, separating concerns, and naming parts accurately, you ensure that your diagrams serve their purpose. They become tools for alignment rather than sources of confusion. This discipline pays off in reduced rework, faster development cycles, and stronger team collaboration.
Focus on the structure that matters. Leave out the noise. Make every element count towards understanding the system architecture.