


Software systems evolve. What began as a simple script often grows into a complex web of dependencies, hidden logic, and tangled execution paths. This accumulation of technical debt creates a state often described as chaos. Developers find themselves navigating through layers of abstraction, unsure of how data flows from the entry point to the database. The solution lies not merely in rewriting code, but in visualizing the existing architecture. A Unified Modeling Language (UML) sequence diagram offers a structured way to map these interactions. By reverse engineering the code, teams can transform opaque logic into clear, communicative blueprints.
This guide outlines the methodology for extracting order from disorder. It focuses on the technical process of observing code execution to construct accurate sequence diagrams. The goal is clarity, maintainability, and a shared understanding among stakeholders. We will explore the mechanics of object interaction, the significance of timing, and the steps required to document these flows without introducing new errors.
Understanding the State of Chaos 🌪️
Before one can repair a system, the nature of the disorder must be understood. Messy code often exhibits specific characteristics that obscure the flow of control. These traits are not merely aesthetic; they represent structural weaknesses that hinder future development.
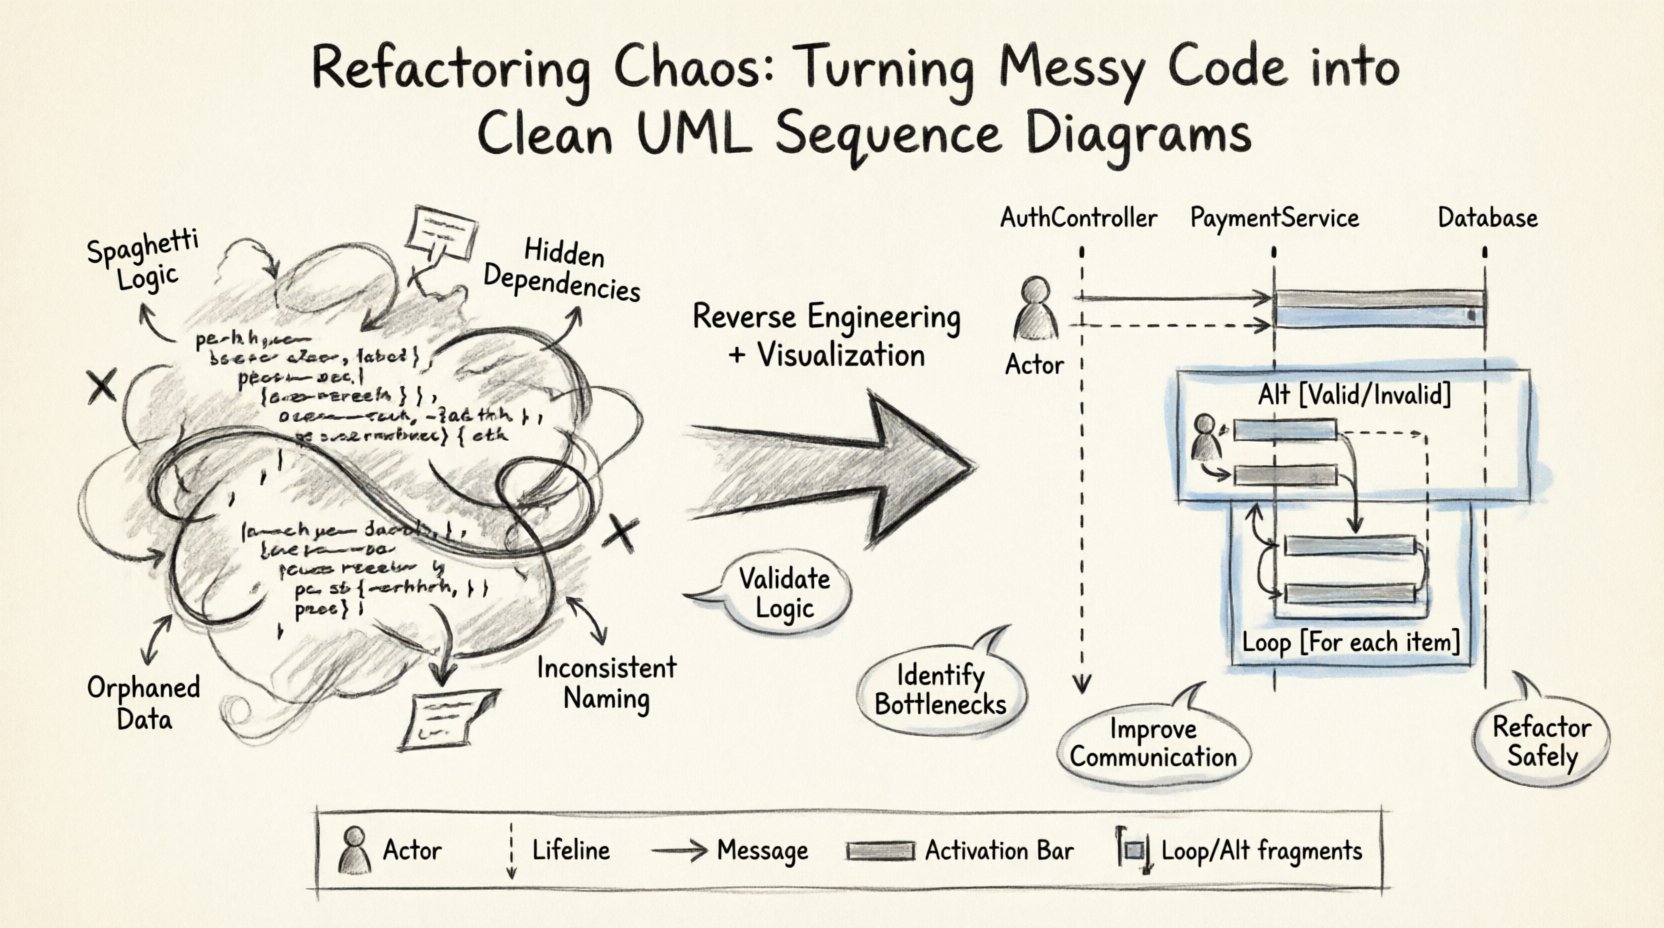
- Spaghetti Logic: Functions that call one another in non-linear, deeply nested ways.
- Hidden Dependencies: Services or modules that are instantiated implicitly within methods, making it hard to trace lifecycles.
- Orphaned Data: Information that is passed around without a clear owner or lifecycle management.
- Inconsistent Naming: Variable and method names that do not reflect their actual purpose or the data they carry.
When code possesses these traits, a developer attempting to add a feature often finds themselves guessing. They insert logic here and there, hoping it fits. This leads to regression bugs and further degradation. A sequence diagram acts as a map. It forces the writer to acknowledge every participant in a specific interaction. It reveals where the system spends time and where it waits.
Consider a typical legacy module. A request arrives. It hits a controller, which calls a service. The service queries a repository. A database returns results. The service transforms them and returns them to the controller. In code, this might be spread across ten files. In a diagram, it is a vertical flow from top to bottom. The visual representation simplifies the cognitive load required to understand the system.
The Value of UML Sequence Diagrams 📐
Why choose a sequence diagram over other forms of documentation? Other diagrams, such as class diagrams, show static structure. They tell you what objects exist and how they relate. They do not tell you what happens when the system runs. A sequence diagram captures the dynamic behavior. It answers the question: What happens when this action occurs?
Key Benefits for Refactoring
- Validation of Logic: By drawing the flow, you verify if the code actually does what it is supposed to do. Discrepancies between the diagram and the code often reveal bugs.
- Identification of Bottlenecks: Long vertical lines or many interactions between objects highlight performance issues before they become critical.
- Communication Tool: A diagram is a universal language. It allows non-technical stakeholders to understand the flow without reading source code.
- Refactoring Safety: When changing code, the diagram serves as a baseline. If the new code deviates from the diagram, the refactoring may have introduced unintended side effects.
Preparation: Setting the Stage 🛠️
Constructing a reliable diagram requires preparation. One cannot simply start drawing while reading code line by line. A strategy must be in place. The process begins with defining the scope. A sequence diagram can represent an entire application, but it is often more effective to focus on a single use case or critical path.
Defining the Scope
Select a specific transaction. For example, “User Login” or “Process Payment.” This provides a clear start and end point. Without boundaries, the diagram becomes too large to read. The focus should remain on the interaction between objects during this specific transaction.
Gathering Context
Before opening the editor, understand the domain. What are the entities involved? Is there an external API? Is there a user interface? Knowing the context helps in naming the lifelines correctly. Generic names like “Object 1” or “Handler” provide little value. Specific names like “AuthController” or “PaymentGateway” convey meaning.
The Extraction Process: From Code to Diagram 🔍
The core task is reverse engineering. This involves tracing the execution path and translating code constructs into diagrammatic elements. It requires patience and attention to detail. The following steps outline the workflow.
Step 1: Identify the Actors
Every interaction begins with a source. In a sequence diagram, this is represented as an Actor. Actors are external entities that initiate the process. They can be human users, other systems, or scheduled tasks.
- Human Users: Represented by the standard stick figure icon.
- External Systems: Represented by a rectangle with the label “Actor” or a specific system name.
- Scheduled Tasks: Represented similarly to external systems.
Start by locating the entry point in the code. This is usually the root method or the API endpoint handler. This method is the trigger for the interaction.
Step 2: Map the Lifelines
Once the actor is identified, identify the objects that participate in the process. Each object gets a Lifeline. A lifeline is a vertical dashed line extending downwards from the object’s name. It represents the existence of that object over time.
When scanning the code, look for:
- Class Instantiation: Where are objects created? These become lifelines.
- Method Calls: Which methods are invoked? These indicate which objects are active.
- State Changes: Which objects hold the data being processed?
Arrange the lifelines horizontally. The order should reflect the logical flow. Typically, the initiator is on the left, and the data storage or external dependencies are on the right. This spatial arrangement aids readability.
Step 3: Draw the Messages
Messages represent the communication between lifelines. They are drawn as horizontal arrows. There are two primary types of messages to distinguish:
- Synchronous Messages: The caller waits for a response. In code, this looks like a standard function call. The arrow is solid with a filled head.
- Asynchronous Messages: The caller does not wait. It sends the signal and continues. In code, this might be an event trigger or a fire-and-forget task. The arrow is dashed with an open head.
Label each message with the method name or action being performed. This provides the “verb” of the interaction. For example, getUserById() or validateToken().
Step 4: Represent Activation Bars
An Activation Bar (or execution occurrence) is a thin rectangle on a lifeline. It indicates when an object is performing an action. It shows the duration of the operation.
To determine when to draw an activation bar:
- Start the bar when the message is received.
- End the bar when the response is sent.
- If the object calls itself (a recursive call), the activation bar continues through the self-message.
This visual cue is crucial for refactoring. It highlights which parts of the code are holding up the thread. If an activation bar is exceptionally long, it suggests a heavy computation or a blocking I/O operation that might need optimization.
Handling Complex Logic 💻
Real-world code rarely follows a straight line. It contains loops, conditions, and error handling. A sequence diagram must represent these complexities to remain accurate.
Loops and Iterations
If a process involves iterating over a collection, use the Loop fragment. This is drawn as a box with the word “Loop” at the top. Inside the box, place the messages that repeat. Add a condition label (e.g., “For each item”) to clarify the scope.
Do not draw every single iteration. This clutters the diagram. The loop fragment indicates that the enclosed messages repeat until a condition is met.
Conditional Paths
Use the Alt (Alternative) fragment for if-else logic. This box contains multiple sections, each with a condition label (e.g., “[Valid Token]”, “[Invalid Token]”). Only one path is taken during a specific execution. Drawing all paths shows the complete decision tree of the system.
Exception Handling
Errors are part of the flow. Use the Opt (Optimal) or Exception fragment to show what happens when something fails. If an error is caught and handled gracefully, show the recovery path. If it propagates, show the exception arrow returning to the caller.
Ignoring error paths creates a false sense of security. A robust diagram accounts for failure states.
Refining the Diagram for Clarity ✨
Once the initial draft is complete, the diagram must be reviewed and refined. A raw extraction of code often contains too much detail. The goal is abstraction that retains meaning.
Grouping Interactions
If a single object performs many small tasks, group them into a single composite message. For example, instead of drawing five separate calls to load configuration, file data, and validate settings, group them under a single InitializeContext() message. This reduces visual noise.
Removing Redundancy
Do not draw every single getter and setter. These are implementation details. Focus on the business logic. If a method simply returns a value without processing, it often does not need to appear as a distinct message unless it is critical to the flow.
Standardizing Notation
Ensure consistency in how elements are drawn. Use solid lines for synchronous calls and dashed lines for asynchronous ones throughout the document. Use standard UML labels for fragments (Alt, Opt, Loop). Consistency helps readers interpret the diagram quickly.
Common Elements Reference Table 📋
To assist in the construction process, here is a reference for standard elements and their code equivalents.
| UML Element | Visual Representation | Code Equivalent | Purpose |
|---|---|---|---|
| Actor | Stick Figure | External API, User, Scheduler | Initiates the process |
| Lifeline | Dashed Vertical Line | Class Instance | Represents existence over time |
| Message | Horizontal Arrow | Method Call | Communication between objects |
| Activation Bar | Rectangular Box | Method Execution Block | Indicates active processing |
| Return Message | Dashed Arrow (Open) | Return Statement | Response to caller |
| Fragment (Alt) | Box with [Condition] | If / Else Block | Conditional logic paths |
| Fragment (Loop) | Box with “Loop” label | For / While Loop | Repeated execution |
Pitfalls to Avoid ⚠️
Even with a clear process, errors can creep into the documentation. Being aware of common mistakes helps maintain quality.
- Overloading a Single Diagram: Trying to show the entire system lifecycle in one image makes it unreadable. Break complex systems into multiple diagrams per feature.
- Ignoring Timing: While sequence diagrams are not timing diagrams, the order matters. Ensure that the vertical order of messages matches the logical sequence of execution.
- Skipping Return Messages: In some styles, return messages are optional. However, for refactoring, showing the return data flow helps understand how data moves back up the stack.
- Naming Ambiguity: Using generic names like “Process” or “Data” makes the diagram useless. Use domain-specific terminology.
- Static vs. Dynamic Confusion: Do not confuse class relationships with message flows. A sequence diagram is about behavior, not structure.
Integrating Diagrams into the Workflow 🔄
Creating a diagram is a one-time effort if the code remains static. However, code changes. To keep the documentation useful, it must be part of the development workflow.
When adding a new feature, the first step should be updating the sequence diagram. This ensures the new logic is understood before it is written. When refactoring, the diagram serves as the target state. The code is changed until it matches the diagram.
This practice creates a feedback loop. The code informs the diagram, and the diagram informs the code. It reduces the risk of introducing architectural drift.
Conclusion on Clean Architecture 🏗️
Turning messy code into clean diagrams is an exercise in discipline. It requires the willingness to pause and observe before acting. The effort invested in documentation pays dividends in reduced debugging time and clearer communication. By following the steps outlined above, teams can reclaim control over their systems. The result is not just a picture, but a deeper understanding of the software they maintain. This understanding is the foundation of sustainable development.
Focus on the flow. Respect the data. Document the interaction. In doing so, chaos becomes order, and complexity becomes clarity. The path forward is defined by the lines you draw now.