


Understanding the flow of interactions within a system requires a clear visual representation. The UML Sequence Diagram serves as the primary tool for this purpose. It maps out how objects communicate over time. Central to this mapping is the concept of object lifecycles. This guide explores how lifecycles function, how to depict them accurately, and how to interpret the resulting diagrams effectively.
When analyzing complex software architectures, clarity is paramount. By focusing on the lifecycle of each object, developers and analysts can identify bottlenecks, potential errors, and logical inconsistencies. We will break down the components that define these lifecycles, ensuring you have the knowledge to create precise and readable diagrams.
🧱 Core Concepts of Sequence Diagrams
Before diving into lifecycles, it is necessary to understand the foundational elements. A sequence diagram is a type of interaction diagram. It shows how objects interact with one another in a specific order.
- Participants: These are the objects or classes involved in the interaction. They appear at the top of the diagram.
- Lifelines: A vertical dashed line extending downward from a participant represents the existence of that object throughout the interaction.
- Messages: Arrows between lifelines indicate communication. They define the flow of data or control.
- Activation Bars: Rectangles placed on the lifeline show when an object is actively performing an operation.
Each element plays a role in defining the lifecycle. The lifecycle specifically refers to the period during which an object exists and performs actions within the context of the system.
📉 The Lifeline: Representing Existence
The lifeline is the backbone of the sequence diagram. It represents the timeline of an object. From the moment it is created to the moment it is destroyed, the lifeline persists.
📍 Positioning and Structure
Participants are aligned horizontally at the top. The lifeline extends vertically. This vertical axis represents time. As the diagram flows from top to bottom, the timeline progresses.
- Start: The top of the lifeline marks the beginning of the object’s participation.
- End: The bottom of the lifeline marks the end of its participation.
- Duration: The length of the lifeline correlates to the duration of the scenario.
It is crucial to distinguish between the participant and the lifeline. The participant is the entity (e.g., a class). The lifeline is the instance of that entity during the interaction.
⚡ Activation Bars: Active Processing
Not every moment on a lifeline is active. An object might be waiting for a response or simply existing without performing tasks. The activation bar (also known as a focus of control) indicates periods of activity.
🛠️ Visual Representation
Activation bars are narrow rectangles centered on the lifeline. They appear when an object receives a message and performs an operation.
- Entry: The bar starts when the object begins processing a message.
- Exit: The bar ends when the operation completes or returns control.
- Nesting: If an object calls another object, the activation bar continues, often creating a nested visual effect.
This visual cue helps analysts understand the workload distribution. Long activation bars indicate heavy processing. Short bars suggest quick operations or simple passes-through.
🔗 Message Types and Communication
Communication drives the lifecycle. Messages trigger state changes and actions. Understanding the different types of messages is essential for accurate diagramming.
📬 Types of Messages
| Message Type | Visual Indicator | Behavior |
|---|---|---|
| synchronous call | Solid line, filled arrowhead | Caller waits for response before continuing |
| Asynchronous call | Solid line, open arrowhead | Caller continues without waiting |
| Return message | Dotted line, open arrowhead | Response sent back to caller |
| Self-message | Curve pointing to the same lifeline | Object calls its own operation |
🔄 Timing and Dependencies
The order of messages matters. Synchronous calls create a dependency. The caller cannot proceed until the receiver finishes. Asynchronous calls allow parallel processing. This distinction impacts the lifecycle of the caller object.
- Blocking: In synchronous calls, the activation bar extends until the return message arrives.
- Non-Blocking: In asynchronous calls, the activation bar ends immediately after sending the message.
Recognizing these differences ensures the diagram reflects the actual system behavior. Incorrect message types can lead to misinterpretation of system latency and responsiveness.
🌱 Object Creation and Destruction
Objects do not exist indefinitely. They are created when needed and destroyed when their purpose is fulfilled. This dynamic nature is a key part of the lifecycle.
🚀 Object Creation
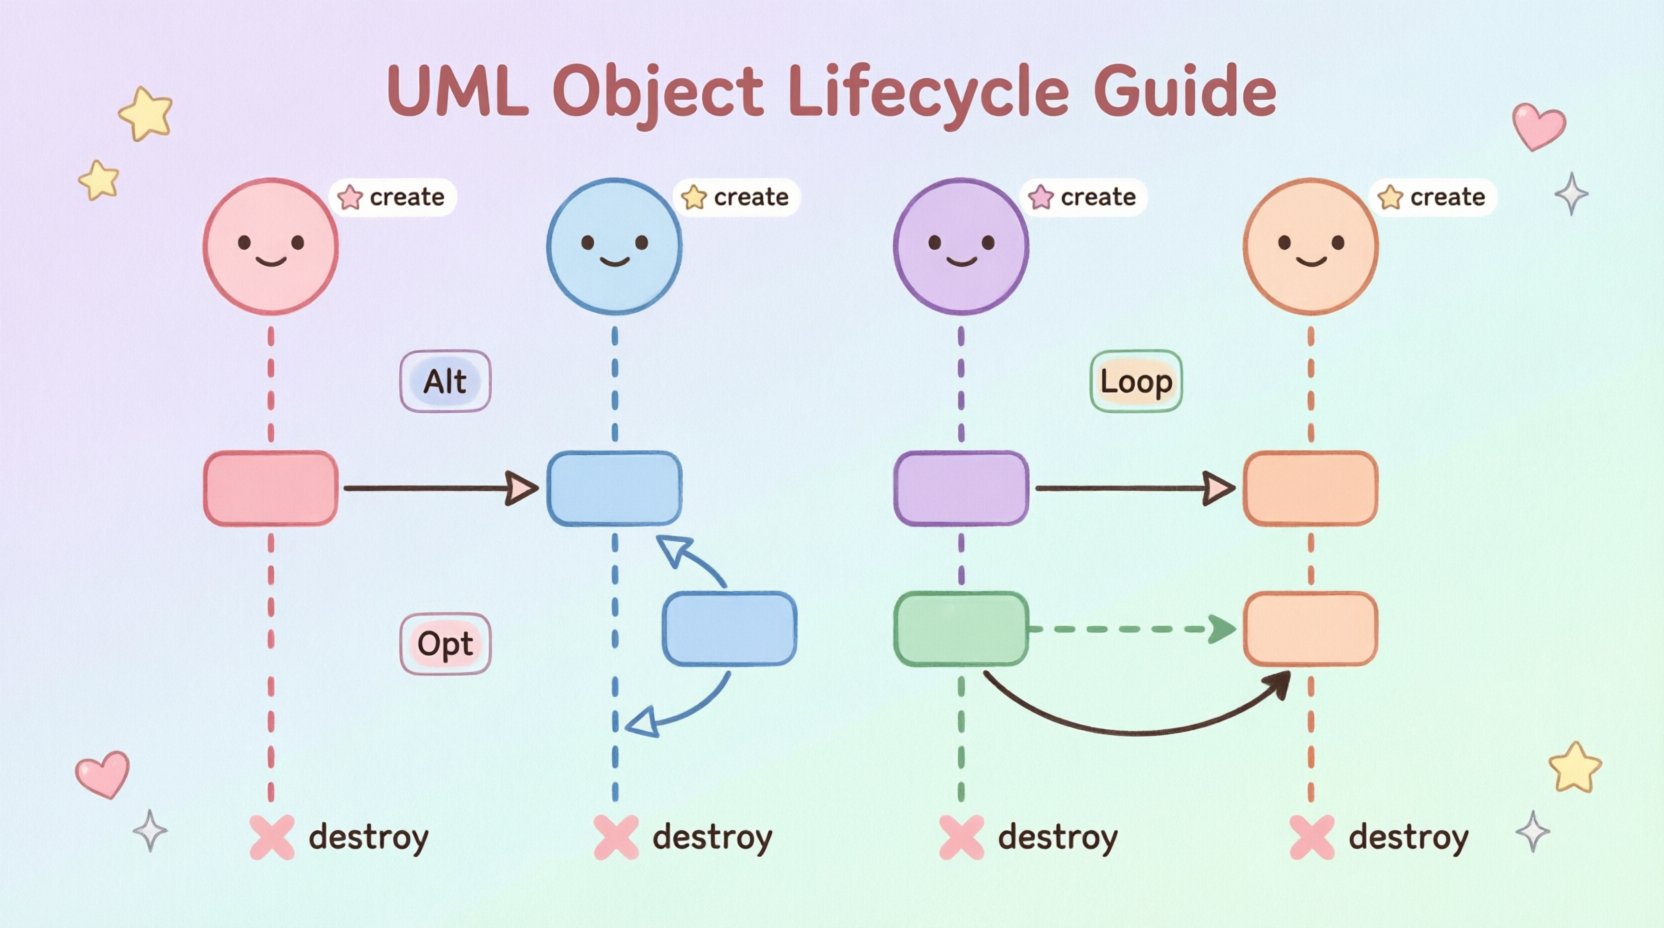
Creation is often represented by a message labeled <<create>>. The arrow points from the creator to the new object.
- Timing: The creation message typically occurs early in the sequence.
- Lifeline Start: The new object’s lifeline begins at the point of creation. It does not exist before this point.
- Initialization: The activation bar on the new object begins immediately after creation.
Some notations show the object name with a tilde (~) or specific icons to denote creation. The key is that the lifeline should not extend above the creation message.
💀 Object Destruction
Destruction marks the end of an object’s participation. It is represented by a cross (X) at the bottom of the lifeline.
- Explicit Destruction: A message labeled
<<destroy>>points to the lifeline. - Visual End: The X symbol replaces the dashed line.
- Memory Release: Conceptually, this represents the release of resources or memory.
Destruction is critical in managing state. If an object persists beyond its logical end, it may cause memory leaks or data inconsistencies. Marking destruction clearly communicates intent.
🔢 Interaction Frames and Grouping
Complex scenarios often require grouping specific interactions. Interaction frames provide a way to organize logic without cluttering the diagram.
📑 Common Frame Types
- Alt (Alternative): Represents conditional logic (if/else). Only one path is taken.
- Opt (Optional): Represents an optional interaction that may or may not occur.
- Loop: Represents repetition (for loops). The interaction happens multiple times.
- Break: Represents an early exit from a loop or interaction.
📝 Impact on Lifecycle
Frames affect how lifecycles are interpreted. For example, in a loop, an object might be created once outside the frame or created repeatedly inside the frame.
- Scope: Objects created inside a frame typically have a lifecycle limited to that frame unless explicitly defined otherwise.
- State: Conditional blocks (Alt) mean different objects may be active depending on the condition met.
Using frames correctly keeps the diagram readable. It separates distinct logical paths while maintaining the timeline context.
🧩 Self-Interaction and Recursion
Objects often interact with themselves. This is common in methods that call other methods within the same class.
🔄 Visualizing Self-Calls
A curved arrow starts and ends on the same lifeline. It indicates recursion or internal processing.
- Activation Extension: The activation bar extends during the self-call.
- Nesting: Multiple self-calls can create a “comb” effect on the lifeline.
This is vital for understanding internal complexity. It shows that an external call triggers a significant internal process.
📏 Timing Constraints
While sequence diagrams focus on order, timing is often relevant. Constraints can be added to messages or lifelines.
- Duration: Time taken for an operation (e.g., “200ms”).
- Deadline: Maximum time allowed for a response.
- Timeout: Time after which an action is cancelled.
Adding timing constraints helps in performance analysis. It highlights potential bottlenecks where objects are blocked longer than expected.
🎯 Best Practices for Clarity
Creating a diagram is only half the work. Ensuring it is understandable by others is equally important.
- Consistent Naming: Use clear names for participants and messages. Avoid abbreviations unless universally understood.
- Limit Scope: Do not try to fit every interaction into one diagram. Split complex flows into multiple diagrams.
- Standardize Arrows: Ensure all message types use the standard notation (solid, dotted, open, closed).
- Minimize Overlap: Avoid crossing lines where possible. It makes the flow harder to trace.
- Document Assumptions: If a diagram implies a specific timing or state, note it in the legend or description.
🛠️ Common Pitfalls to Avoid
Even experienced practitioners make mistakes. Being aware of common errors helps maintain quality.
- Ignoring Destruction: Leaving lifelines active when they should end creates confusion about resource usage.
- Mixing Levels: Combining high-level user interactions with low-level database queries in one diagram reduces readability.
- Unclear Message Flow: Using arrows that point in the wrong direction or lack labels.
- Overcrowding: Too many objects on one line make the diagram difficult to follow.
🔍 Interpreting Complex Scenarios
Real-world systems are rarely linear. They involve branching, looping, and parallel processing. Interpreting these scenarios requires a methodical approach.
🧭 Tracing the Path
Start at the top. Follow the message arrows. Track the activation bars. Note where lifelines begin and end.
- Check for Loops: Identify where the diagram repeats actions.
- Identify Forks: Look for Alt frames that split the path.
- Verify Endpoints: Ensure all paths lead to a logical conclusion or return state.
🤝 Collaboration Impact
Sequence diagrams facilitate communication between developers, testers, and stakeholders. They serve as a shared language.
- Design Reviews: Use diagrams to validate architecture before coding.
- Testing: Test cases can be derived directly from the message sequences.
- Documentation: They provide a living record of how the system is intended to function.
📝 Summary of Lifecycle Elements
To summarize, the lifecycle in a UML sequence diagram is defined by several key components.
- Lifelines: Define the timeline of existence.
- Activation Bars: Define periods of active processing.
- Messages: Define the triggers for state changes.
- Creation/Destruction: Define the start and end points of the object.
- Frames: Define the logical grouping of interactions.
Mastering these elements allows for the creation of robust diagrams. They provide insight into system behavior that code alone cannot easily convey.
🔎 Future Considerations
As systems evolve, so do the diagrams. Modern architectures often involve microservices, cloud functions, and asynchronous event streams. These add complexity to the lifecycle model.
- Asynchronous Events: Events may occur without a direct caller, requiring different message notations.
- Distributed Systems: Lifelines may span multiple network nodes, requiring clear labeling of context.
- State Management: Objects may hold state across multiple sessions, complicating the destruction model.
Staying updated with these nuances ensures your diagrams remain relevant and accurate.
🏁 Final Thoughts
The lifecycle of an object in a UML sequence diagram is more than a drawing exercise. It is a logical representation of system behavior. By paying attention to lifelines, activations, and messages, you gain a deeper understanding of the architecture.
Focus on clarity and accuracy. Avoid unnecessary complexity. Ensure every element serves a purpose in explaining the interaction. When done correctly, these diagrams become powerful tools for analysis and communication.
Use this guide as a reference. Revisit the concepts as you encounter new challenges. The more you practice, the more intuitive the process becomes. Your diagrams will reflect the quality of your design.