


Designing and maintaining robust API integrations requires clear communication between teams. A common challenge in system architecture is visualizing the flow of data between different components. UML sequence diagrams provide a structured way to represent these interactions over time. This guide outlines a methodical approach to documenting API calls using this notation.
When developers, architects, and stakeholders align on the behavior of an interface, the risk of misinterpretation decreases significantly. Sequence diagrams capture the chronological order of messages exchanged between objects or systems. For API documentation, this means showing exactly what happens when a request is sent and how the system responds.
🧩 Understanding the Core Components
Before drawing any lines or boxes, it is essential to understand the fundamental building blocks of a sequence diagram. Each element serves a specific purpose in conveying the logic of the interaction.
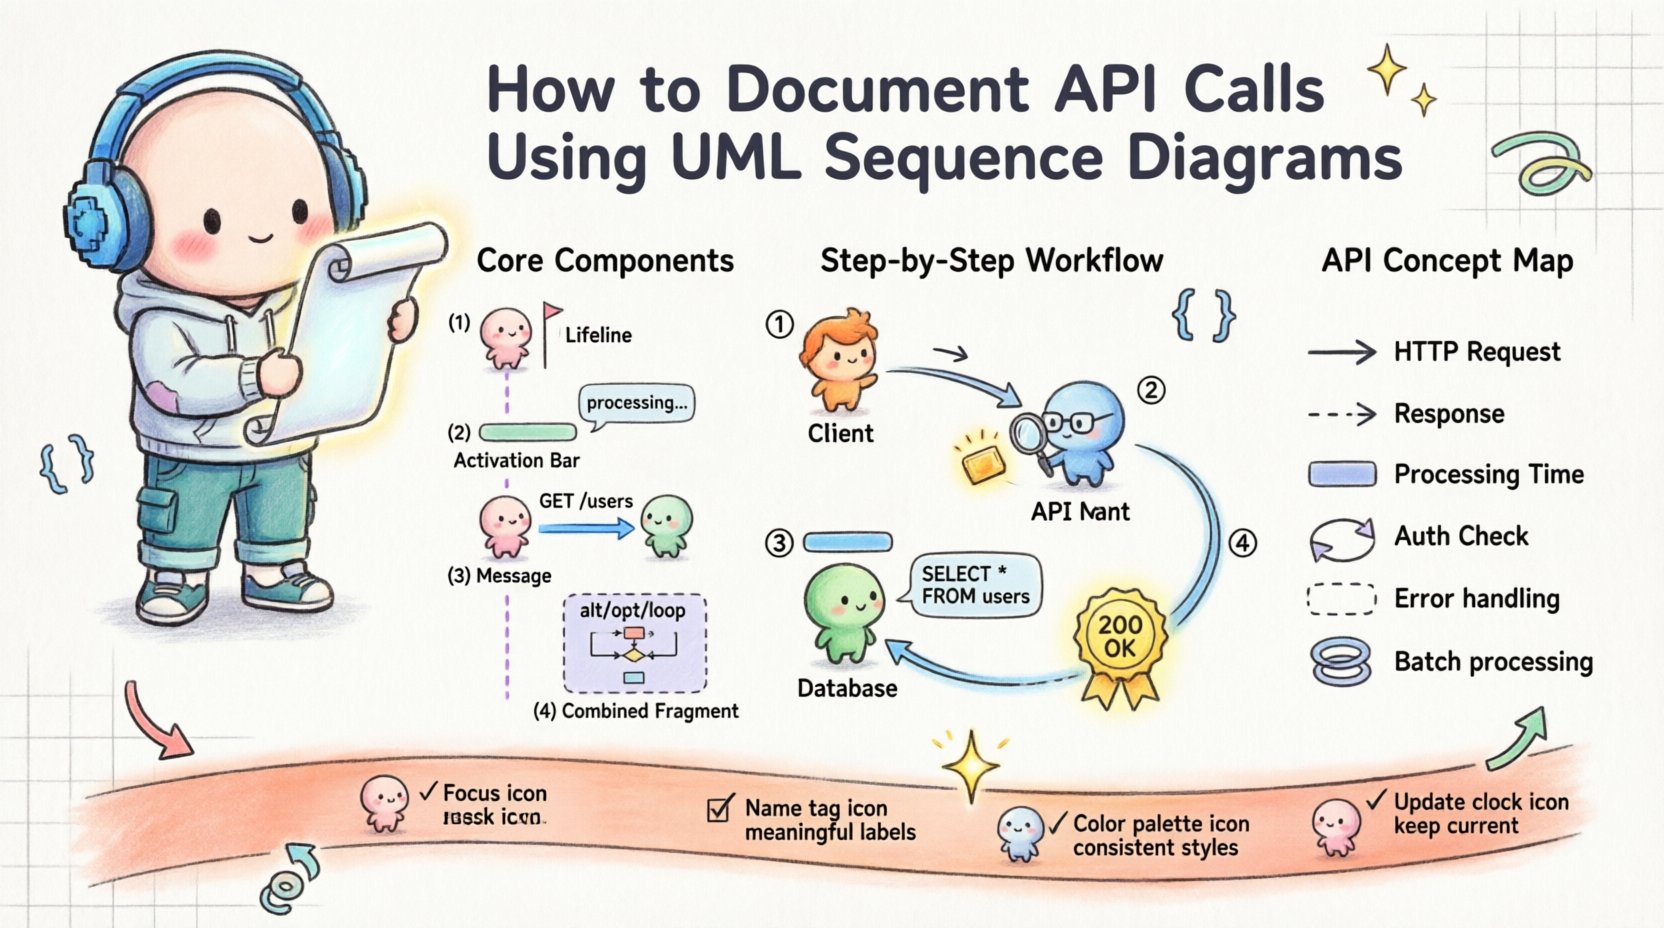
- Lifelines: These represent the participants in the interaction. In the context of APIs, lifelines typically include the client application, the API gateway, the authentication service, and the backend database. A vertical dashed line extends downward from the participant’s box, representing their existence over time.
- Activation Bars: Also known as execution occurrences, these are thin rectangles placed on a lifeline. They indicate the period during which the participant is actively performing an action. For example, when a server is processing a request, an activation bar appears on its lifeline.
- Messages: Horizontal arrows connecting lifelines represent the flow of information. Solid arrows usually denote synchronous calls, while dashed arrows indicate return messages or asynchronous responses.
- Combined Fragments: These are boxes that group interaction fragments to show logic such as loops, conditions, or optional steps. They are marked with keywords like
alt,opt, orloop.
Using these elements correctly ensures that the diagram remains readable even as complexity grows. A diagram that relies on too many nested fragments can become difficult to parse. Simplicity is a virtue in technical documentation.
🛠️ Step-by-Step Construction Guide
Creating a sequence diagram is not merely about drawing shapes. It requires a deliberate process to ensure accuracy and utility. Follow this structured workflow to produce high-quality documentation.
1. Identify the Participants
Begin by listing every entity involved in the specific API flow. Do not limit this to just the client and the server. Consider intermediate layers.
- Client Application (e.g., Web Browser, Mobile App)
- Load Balancer or API Gateway
- Authentication Middleware
- Primary Service Handler
- External Third-Party Services
- Database or Storage System
Label each participant clearly at the top of the diagram. Consistent naming conventions prevent confusion later on.
2. Define the Trigger Event
Every sequence starts with an action. This is usually an HTTP request initiated by a client. Specify the HTTP method and the endpoint.
- GET /users: Retrieving a list of users.
- POST /orders: Creating a new order.
- DELETE /items/:id: Removing a specific item.
Place the first message arrow originating from the client lifeline. This sets the timeline for the rest of the interaction.
3. Map the Processing Logic
As the request moves through the system, it may trigger multiple internal calls. Document these sequentially. If the API gateway validates a token before passing the request, show that step explicitly.
Use activation bars to show when a component is busy. For instance, if the database query takes time, the activation bar on the database lifeline should extend to cover that duration. This visual cue helps developers understand latency points.
4. Handle Responses and Return Flows
APIs are bidirectional. For every request, there is a response. Draw dashed arrows returning from the bottom of the activation bars to the originator.
- Success responses (200 OK, 201 Created)
- Error responses (400 Bad Request, 500 Internal Server Error)
- Timeout scenarios
Clearly label the status codes on the return arrows. This is critical for understanding the contract between services.
🔄 Advanced Interaction Patterns
Simple request-response flows are common, but real-world APIs often involve complex logic. UML sequence diagrams support combined fragments to handle these scenarios without cluttering the diagram.
Conditional Logic (Alt/Opt)
Use alt (alternative) frames when the flow depends on a specific condition. For example, if a user is authenticated, proceed to the data layer. If not, return a 401 Unauthorized.
Use opt (optional) frames for steps that may or may not occur. A logging mechanism might be optional in a development environment but required in production.
Loops (Loop)
When a single request triggers multiple operations, such as iterating through a list of items, use a loop frame. This indicates that the enclosed interaction repeats until a condition is met.
This is particularly useful for batch processing APIs where a single call initiates a series of updates.
Reference (Ref)
If a sequence of interactions is complex and detailed, use a ref frame to reference another diagram. This keeps the current diagram focused on the high-level flow while allowing deep dives into specific subsystems elsewhere.
📊 Mapping API Concepts to Diagram Elements
To ensure consistency across documentation, it helps to have a reference table that maps standard API concepts to their sequence diagram representations.
| API Concept | Sequence Diagram Element | Visual Representation |
|---|---|---|
| HTTP Request | Message Arrow | Solid line with filled arrowhead |
| HTTP Response | Return Message | Dashed line with open arrowhead |
| Processing Time | Activation Bar | Rectangle on Lifeline |
| Authentication Check | Self-Message or Internal Call | Arrow from Lifeline to itself |
| Timeout / Error | Combined Fragment (Alt) | Box labeled ‘Alt’ with ‘Exception’ option |
| Batch Processing | Combined Fragment (Loop) | Box labeled ‘Loop’ with ‘x’ condition |
This table serves as a quick reference for documentation teams. It standardizes the visual language used across different projects.
🎯 Best Practices for Clarity
A diagram that is accurate but unreadable fails its purpose. Follow these guidelines to maintain clarity.
- Keep it Focused: Do not attempt to document the entire system in one diagram. Break complex flows into smaller, manageable diagrams. A single diagram should cover one specific use case, such as “User Login” or “Order Creation”.
- Use Meaningful Names: Avoid generic labels like “Message 1”. Instead, use “GET /api/v1/users” or “Send Email Notification”. This provides context without needing external notes.
- Limit Vertical Space: If a diagram becomes too tall, it loses context. Use reference frames to abstract away details that are not critical to the current view.
- Standardize Arrow Styles: Ensure all request arrows look the same and all response arrows look the same. Consistency reduces cognitive load for the reader.
- Highlight Critical Paths: Use bold lines or distinct colors for the happy path (successful flow). This helps readers quickly understand the primary scenario.
- Include Data Payloads Sparingly: While showing data types is helpful, avoid pasting full JSON bodies into the diagram. Instead, note the key fields involved, such as
{ userId, token }.
🔗 Integration with API Specifications
Modern API development often involves specification languages like OpenAPI (Swagger). While these documents define the schema and endpoints, they do not inherently explain the flow. Sequence diagrams complement these specifications.
- Validation: Use the sequence diagram to verify that the OpenAPI specification covers all necessary interaction steps, including error handling.
- Discovery: When developers review the sequence diagram, they can cross-reference it with the OpenAPI file to find the specific endpoint definitions.
- Gap Analysis: If a diagram shows a step that is not defined in the specification, it indicates a missing API endpoint or a logic gap.
This dual-documentation approach ensures that both the contract (API spec) and the behavior (sequence diagram) are aligned.
🔄 Maintenance and Versioning
Software evolves. APIs change, endpoints get deprecated, and logic shifts. A static diagram becomes obsolete quickly if not maintained.
- Version Control: Treat diagram files like code. Store them in a repository where changes are tracked. Tag versions corresponding to API releases.
- Review Cycles: Include diagram updates in the code review process. If a developer changes the logic of an endpoint, the diagram must be updated simultaneously.
- Deprecation Labels: When an endpoint is marked for removal, annotate the diagram clearly. Do not simply delete it, as this helps developers understand legacy flows.
- Automated Checks: Where possible, use tools to validate that the diagram matches the actual code logic. This reduces the risk of documentation drift.
🚫 Common Pitfalls to Avoid
Avoiding common mistakes saves time and prevents confusion. Be aware of these frequent errors.
- Ignoring Asynchronous Calls: Webhooks and event-driven architectures rely on asynchronous messaging. Do not force these into a synchronous flow. Use appropriate return symbols.
- Overloading the Diagram: Trying to show every error code and edge case in one diagram makes it unreadable. Separate the happy path from the error handling paths.
- Mixing Layers: Do not mix database queries with UI interactions in the same diagram unless relevant. Keep network calls separate from internal processing where possible.
- Unclear Timing: If the order of operations matters (e.g., authentication before data access), ensure the vertical alignment reflects the strict sequence.
📝 Summary of Key Takeaways
Effective documentation bridges the gap between design and implementation. UML sequence diagrams offer a powerful visual language for this purpose.
- Clarity over Complexity: Prioritize readability. If a reader cannot understand the flow in 30 seconds, simplify the diagram.
- Consistency is Key: Maintain a standard style guide for all diagrams within the organization.
- Keep it Updated: Treat documentation as a living artifact that evolves with the codebase.
- Focus on Flow: The primary goal is to show how data moves and transforms between systems.
By adhering to these principles, technical teams can create documentation that aids in onboarding, debugging, and system design. The effort invested in precise diagramming pays off in reduced communication overhead and fewer integration errors.