


Designing complex software systems requires more than just writing code. It demands a clear visualization of how different components interact over time. A Unified Modeling Language (UML) sequence diagram serves as a critical artifact in this process. It captures the dynamic behavior of a system, illustrating the exchange of messages between objects or actors. When constructed correctly, these diagrams provide a roadmap for logic flow, ensuring that every operation follows a predictable and robust path. This guide explores the intricacies of building these diagrams, focusing on clarity, accuracy, and maintainability without relying on specific proprietary tools.
Understanding the Core Purpose 🎯
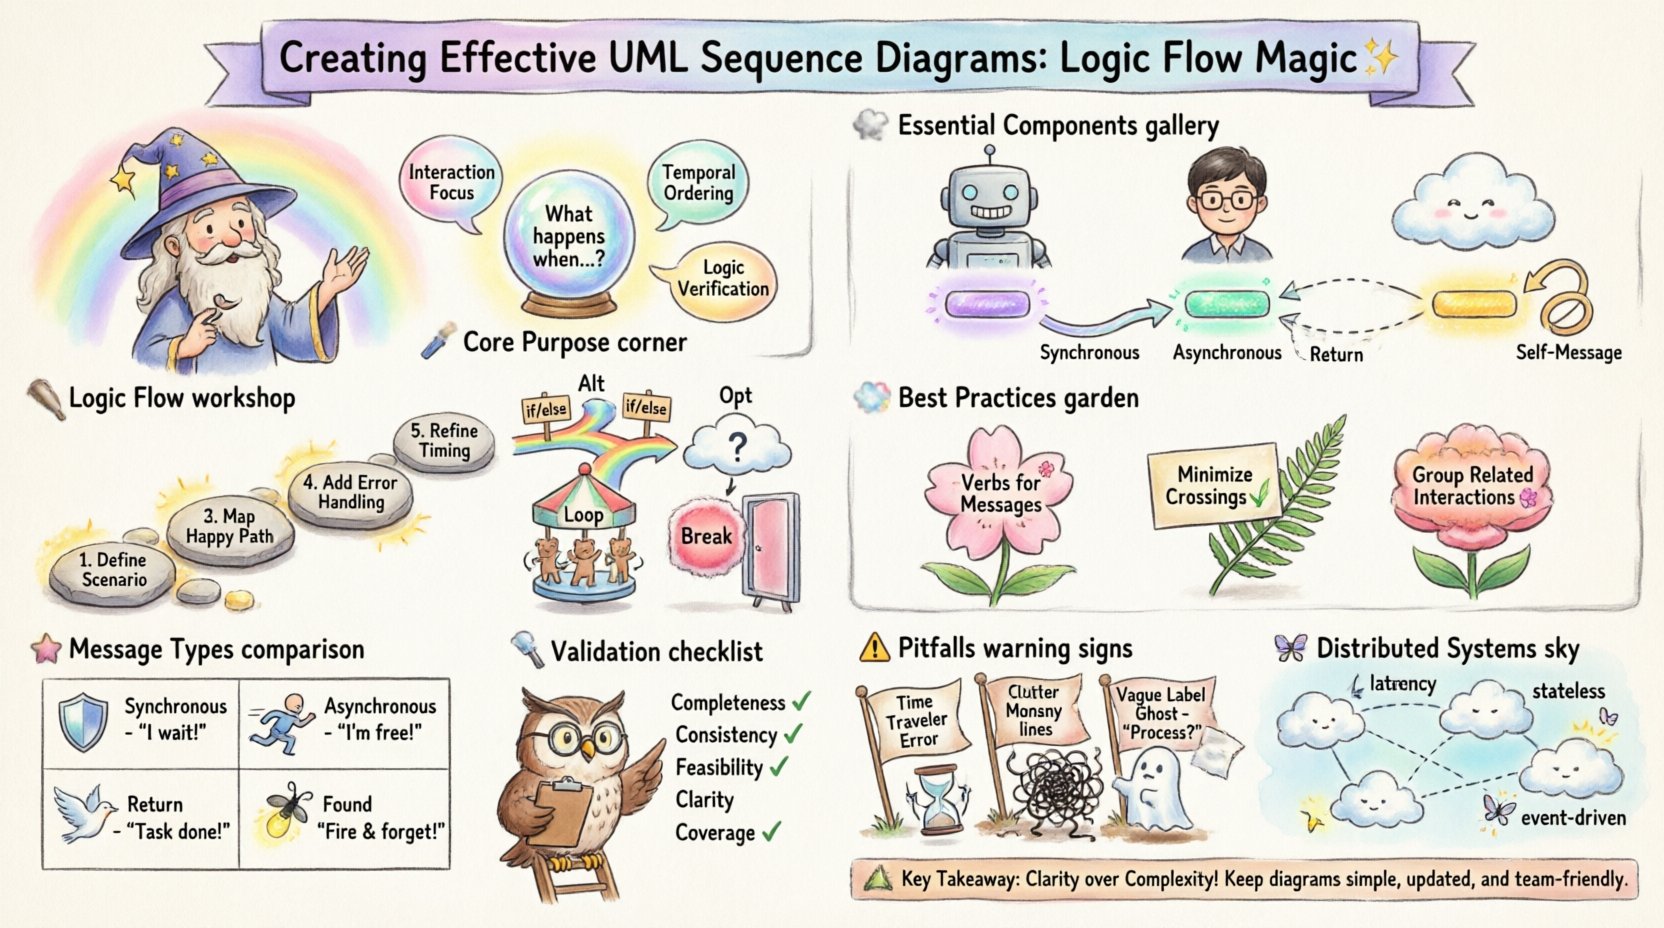
Before drawing a single line, it is essential to understand what a sequence diagram actually represents. Unlike a class diagram, which shows static structure, a sequence diagram focuses on behavior and timing. It answers the question: “What happens when a specific event occurs?”.
- Interaction Focus: It highlights the collaboration between parts of the system.
- Temporal Ordering: It shows the sequence in which messages are sent.
- Logic Verification: It allows developers to trace error paths and success paths before implementation begins.
By visualizing the flow of data and control, teams can identify potential bottlenecks, race conditions, or logical gaps early in the design phase. This proactive approach saves significant resources during the development and testing stages.
Essential Components of a Sequence Diagram 🧩
To create a diagram that communicates effectively, you must master the standard notation. Each element has a specific meaning that contributes to the overall logic. Skipping definitions or using incorrect symbols can lead to misinterpretation.
1. Participants and Actors 👥
Participants represent the entities involved in the interaction. These can be:
- External Actors: Human users, third-party APIs, or hardware devices initiating the process.
- Internal Objects: Classes, services, or modules within the application boundary.
- Boundaries: User interfaces or gateways that mediate access.
Each participant is depicted as a rectangle at the top of the diagram. The name should be specific, often including the class name or role, such as “User Interface” or “Payment Service”.
2. Lifelines ⏳
Extending vertically from each participant is a dashed line known as the lifeline. This line represents the existence of the object over time. It does not imply physical duration but rather logical availability during the interaction. A broken lifeline indicates that the object is no longer relevant to the current interaction sequence.
3. Activation Bars ⚡
Placed on top of the lifeline, activation bars (or execution occurrences) indicate when an object is actively performing an operation. When an incoming message triggers a method, the bar appears. It ends when the method returns or when the object passes control to another component. This visual cue is crucial for understanding concurrency and processing load.
4. Messages 💬
Messages are the arrows connecting lifelines. They represent the communication between participants. There are distinct types of messages, each carrying different semantic weight:
- Synchronous: The sender waits for a response. The arrow is solid with a filled head.
- Asynchronous: The sender does not wait. The arrow is solid with an open head.
- Return: The response sent back to the caller. Usually a dashed line with an open head.
- Self-Message: An object calling a method on itself. The arrow loops back to the same lifeline.
Structuring Logic Flow 🛠️
Creating a logical sequence involves more than just drawing arrows. You must structure the narrative of the interaction. This section details how to organize the flow for maximum readability and accuracy.
Step-by-Step Construction Process
- Define the Scenario: Start with a specific use case. For example, “User logs in” or “Order is placed”. Avoid trying to capture every possible system function in one diagram.
- Identify Participants: List all objects required to execute the scenario. Keep the list minimal to avoid clutter.
- Map the Primary Flow: Draw the happy path first. This is the sequence of events that occurs when everything works as expected.
- Add Error Handling: Once the primary flow is stable, integrate exception paths. Show what happens if a service is unavailable or validation fails.
- Refine Timing: Ensure that the vertical position of messages reflects the chronological order of events.
Using Control Structures for Complexity
Real-world logic rarely follows a straight line. Control structures allow you to represent conditional logic and repetition within the diagram. These are typically enclosed in frames.
Alt (Alternative)
Used to show branching logic. It represents an “if-else” scenario. The frame is divided into sections, each with a guard condition. Only one section is executed based on the condition met.
Opt (Optional)
Similar to Alt, but used when a condition is not strictly required for the main flow. It represents an optional step that may or may not occur.
Loop
Indicates repetitive behavior. The frame surrounds the sequence of messages that occur multiple times. A condition inside the frame defines the termination criteria.
Break
Used to indicate that the normal flow is terminated early due to an exception or a specific exit condition.
Best Practices for Clarity and Precision 📝
A diagram that is too complex defeats its purpose. The goal is communication, not decoration. Adhering to established conventions ensures that stakeholders can interpret the logic without confusion.
1. Naming Conventions
Consistency is key. Use the following guidelines for labels:
- Verbs for Messages: Start message labels with verbs (e.g., “Retrieve Data”, “Validate Input”).
- Nouns for Objects: Use nouns for participants (e.g., “Customer”, “Database Connection”).
- LowerCamelCase: For internal method names, use standard coding conventions to maintain alignment with the codebase.
2. Minimizing Cross-References
Limit the number of horizontal lines. Excessive crossing makes it difficult to trace the path of a message. If a diagram becomes tangled, consider splitting it into multiple smaller diagrams focusing on specific sub-processes.
3. Grouping Related Interactions
Use frames or combined fragments to group logic that belongs together. This helps in identifying modular sections of the interaction. For instance, all authentication-related messages should be grouped within a specific boundary.
Comparing Message Types and Implications 📊
Choosing the right message type affects how developers implement the logic. A synchronous call blocks the thread, while an asynchronous call allows the system to continue. The table below outlines the differences and their architectural implications.
| Message Type | Symbol | Behavior | Architectural Implication |
|---|---|---|---|
| Synchronous | ⬛ (Filled Arrow) | Caller waits for response | Blocks execution; requires immediate processing capability. |
| Asynchronous | ⬜ (Open Arrow) | Caller continues immediately | Non-blocking; suitable for background tasks or logging. |
| Return | —> (Dashed) | Response sent back | Confirms completion; may contain data payload. |
| Found Message | ⬜ (Open with Dot) | Signal without explicit return | Fire-and-forget; no response expected. |
Common Pitfalls and How to Avoid Them ⚠️
Even experienced designers make mistakes. Recognizing these common errors can help you refine your diagrams and prevent miscommunication.
- Ignoring Time: Ensure the vertical axis represents time. If a message is sent before another, it must be higher on the diagram. Misplaced messages imply incorrect timing logic.
- Overloading Diagrams: Trying to show every edge case in one diagram makes it unreadable. Split complex scenarios into “Happy Path” and “Exception Path” diagrams.
- Ambiguous Labels: Avoid generic labels like “Process” or “Check”. Be specific, such as “Validate Credit Card” or “Calculate Tax”.
- Mixing Concerns: Do not mix UI logic with database logic in the same flow unless necessary. Keep layers distinct to maintain separation of concerns.
- Missing Activation Bars: Omitting activation bars can hide the duration of processing. This makes it harder to identify performance bottlenecks.
Validation and Review Strategies 🔍
Once a diagram is drafted, it requires rigorous review. A peer review process ensures that the logic holds up against technical constraints.
Checklist for Diagram Validation
- Completeness: Does every message have a corresponding return or termination?
- Consistency: Are the participant names consistent with the class diagrams?
- Feasibility: Can the system actually perform these steps within the expected timeframes?
- Clarity: Can a new team member understand the flow without asking questions?
- Coverage: Do the control structures cover all necessary conditions (e.g., null checks, timeout scenarios)?
Advanced Considerations for Distributed Systems 🌐
In modern architectures, components are often distributed across different networks or microservices. Sequence diagrams must adapt to reflect these realities.
- Network Latency: Consider where the activation bars are placed. Remote calls have longer durations than local method calls. Visualize this with wider activation bars or annotations.
- Statelessness: If a service is stateless, the diagram should reflect that no data is retained between calls unless passed explicitly.
- Event-Driven Flows: In event-driven systems, messages may not be direct requests. They might be published events. Use the “Signal” notation to indicate these occurrences.
Summary of Key Takeaways 🏁
Effective UML sequence diagrams are foundational to clear system design. They bridge the gap between abstract requirements and concrete implementation. By adhering to standard notation, focusing on logical flow, and avoiding common pitfalls, you can create diagrams that serve as reliable documentation.
Remember that a diagram is a living artifact. As the system evolves, the diagram should be updated to reflect new logic. Regular maintenance ensures that the documentation remains accurate and useful. Prioritize clarity over completeness. A simple diagram that is understood by the team is more valuable than a complex one that is ignored.
Through disciplined construction and regular review, these diagrams become powerful tools for collaboration. They facilitate discussions about architecture, highlight potential risks, and align the team on the intended behavior of the software. Investing time in this visual planning pays dividends in reduced rework and higher quality code.